Disclaimer: The opinions expressed by our writers are their own and do not represent the views of U.Today. The financial and market information provided on U.Today is intended for informational purposes only. U.Today is not liable for any financial losses incurred while trading cryptocurrencies. Conduct your own research by contacting financial experts before making any investment decisions. We believe that all content is accurate as of the date of publication, but certain offers mentioned may no longer be available.
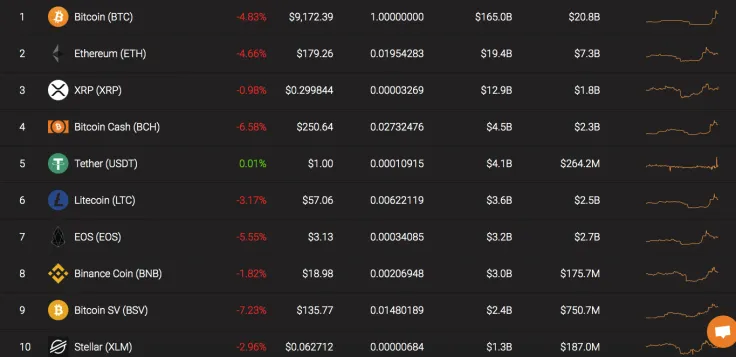
After a short-lived bull revival when the prices of most of the top coins went through the roof, the cryptocurrency market experienced a major correction. Yesterday, all of the top 10 coins were located in the green zone, but all of them are facing a decline today. Bitcoin SV remains the biggest loser, plunging by 7.23%.

Let’s take a look at the market cap of Ethereum, Bitcoin Cash, and Litecoin.
|
Name
Ripple Partners With Deutsche Bank, $2 Billion in Bitcoin Scooped by Whales, Schwartz Criticizes Logan Paul, Shiba Inu Price Enters Consolidation — Top Weekly Crypto News
Crypto Market Review: Shiba Inu Price Momentum Returns In New Uptrend, Is Ethereum (ETH) Stuck in the Mud? Bitcoin Isn't Giving Up on $70,000
|
Ticker Advertisement
|
Market Cap |
Price |
Volume (24h) Advertisement
|
Change (24h) |
|
Ethereum |
ETH |
$165 303 044 059 |
$9 175,77 |
$32 433 533 643 |
-4.83% |
|
Bitcoin Cash |
BCH |
$4 531 444 036 |
$250,64 |
$3 228 652 080 |
-6.58% |
|
Litecoin |
LTC |
$3 611 867 388 |
$56,83 |
$4 516 514 170 |
-3.17% |
ETH/USD
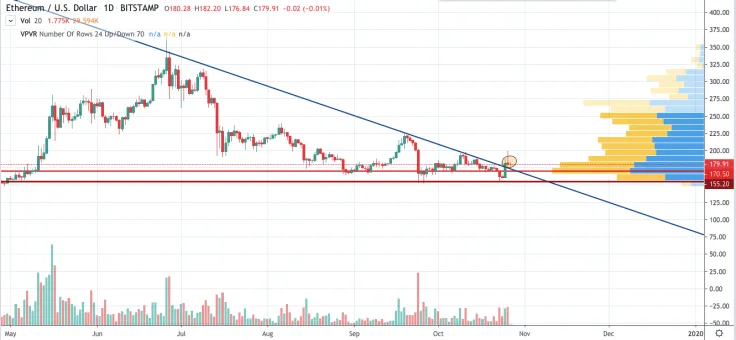
Two days ago, Ethereum followed the bullish run of Bitcoin. The peak price that was recorded on the Bitfinex exchange was at around $199. Today, bears have already pushed back the price of the second largest altcoin to $180.

Even though ETH was followed in Bitcoin's footsteps, it failed to show such a huge uptick as the leading cryptocurrency, which skyrocketed by more than 20%. On the 1D chart, Ethereum is trying to break above the bearish line formed at the end of June 2019.
However, it is unlikely to happen anytime soon given that the market is currently trapped in the bearish trend. Moreover, the recent price growth was not accompanied by a huge spike in trading volume. Summing up, if bulls do not manage to break above the bearish trend line, the support level at $155 will be reached by mid-November.
Ethereum is trading at $179.91 at press time.
BCH/USD
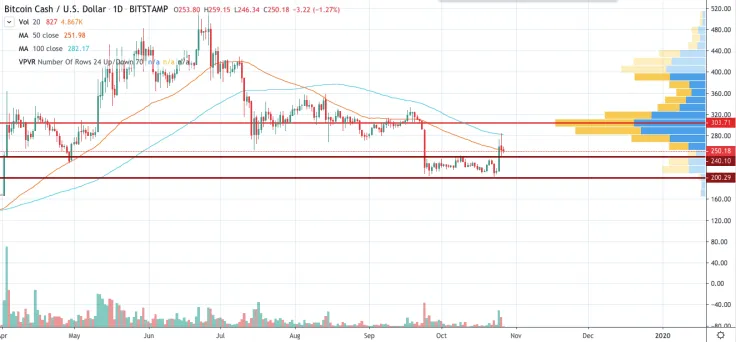
The recent growth of the cryptocurrency market has affected the price of Bitcoin Cash. The controversial Bitcoin hard fork has come back to the levels that were seen at the end of September 2019.

According to the graph above, the bigger picture has not changed. BCH continues moving within the bearish cycle. The current price is located between its 100 MA and 50 MA, which confirms the ongoing decline. In addition, the price blast that took place two days ago cannot be considered as an organic (it was rather an artificial pump).
Respectively, the closest level at $240 will be reached soon. If BCH cannot hold it, the bears will push the price up to $200.
Bitcoin Cash is trading at $250.18 at press time.
LTC/USD
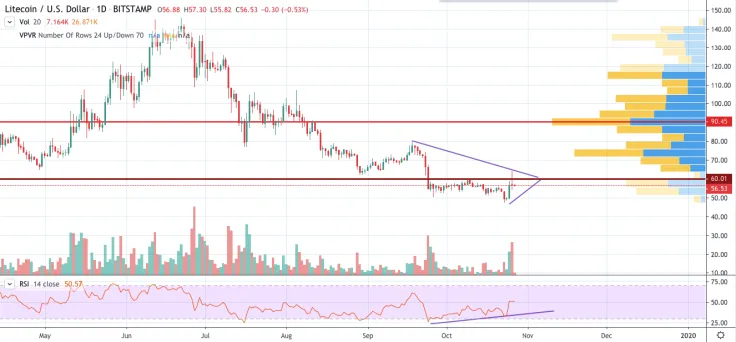
In terms of Litecoin, the growth has positively affected the price of the ’digital silver’ not just in the short-term, but in the long-term as well. The coin has gained 5% over the last 7 days.

On the 1D chart, Litecoin has formed a bullish divergence, according to the RSI indicator. The bottom of $50 has been passed, and LTC is staging a much-awaited reversal. Currently, the focus is on the $60 price level.
If buyers can break it, the bullish trend will start, but there should be a high-volume breakout.
Litecoin is trading at $56.53 at press time.


 Vladislav Sopov
 Dan Burgin