
Disclaimer: The opinions expressed by our writers are their own and do not represent the views of U.Today. The financial and market information provided on U.Today is intended for informational purposes only. U.Today is not liable for any financial losses incurred while trading cryptocurrencies. Conduct your own research by contacting financial experts before making any investment decisions. We believe that all content is accurate as of the date of publication, but certain offers mentioned may no longer be available.
The price performance of multiple assets paints a mixed picture: it brings uncertainty for assets like XRP, Ethereum and Bitcoin. The most common picture right now is the rapid surge of selling pressure on multiple assets following the beginning of the trading week.
XRP's momentum coming to end?
After forming what appears to be a head and shoulders pattern, a traditional bearish setup that frequently indicates the exhaustion of upward momentum, XRP may be headed toward a short-term correction.
The chart structure displays a head at approximately $3.70, a distinct left shoulder close to $3.20, and what now looks to be a growing right shoulder at approximately $3. A possible breakdown is typically preceded by such a formation, particularly if the asset is unable to sustain crucial support levels.
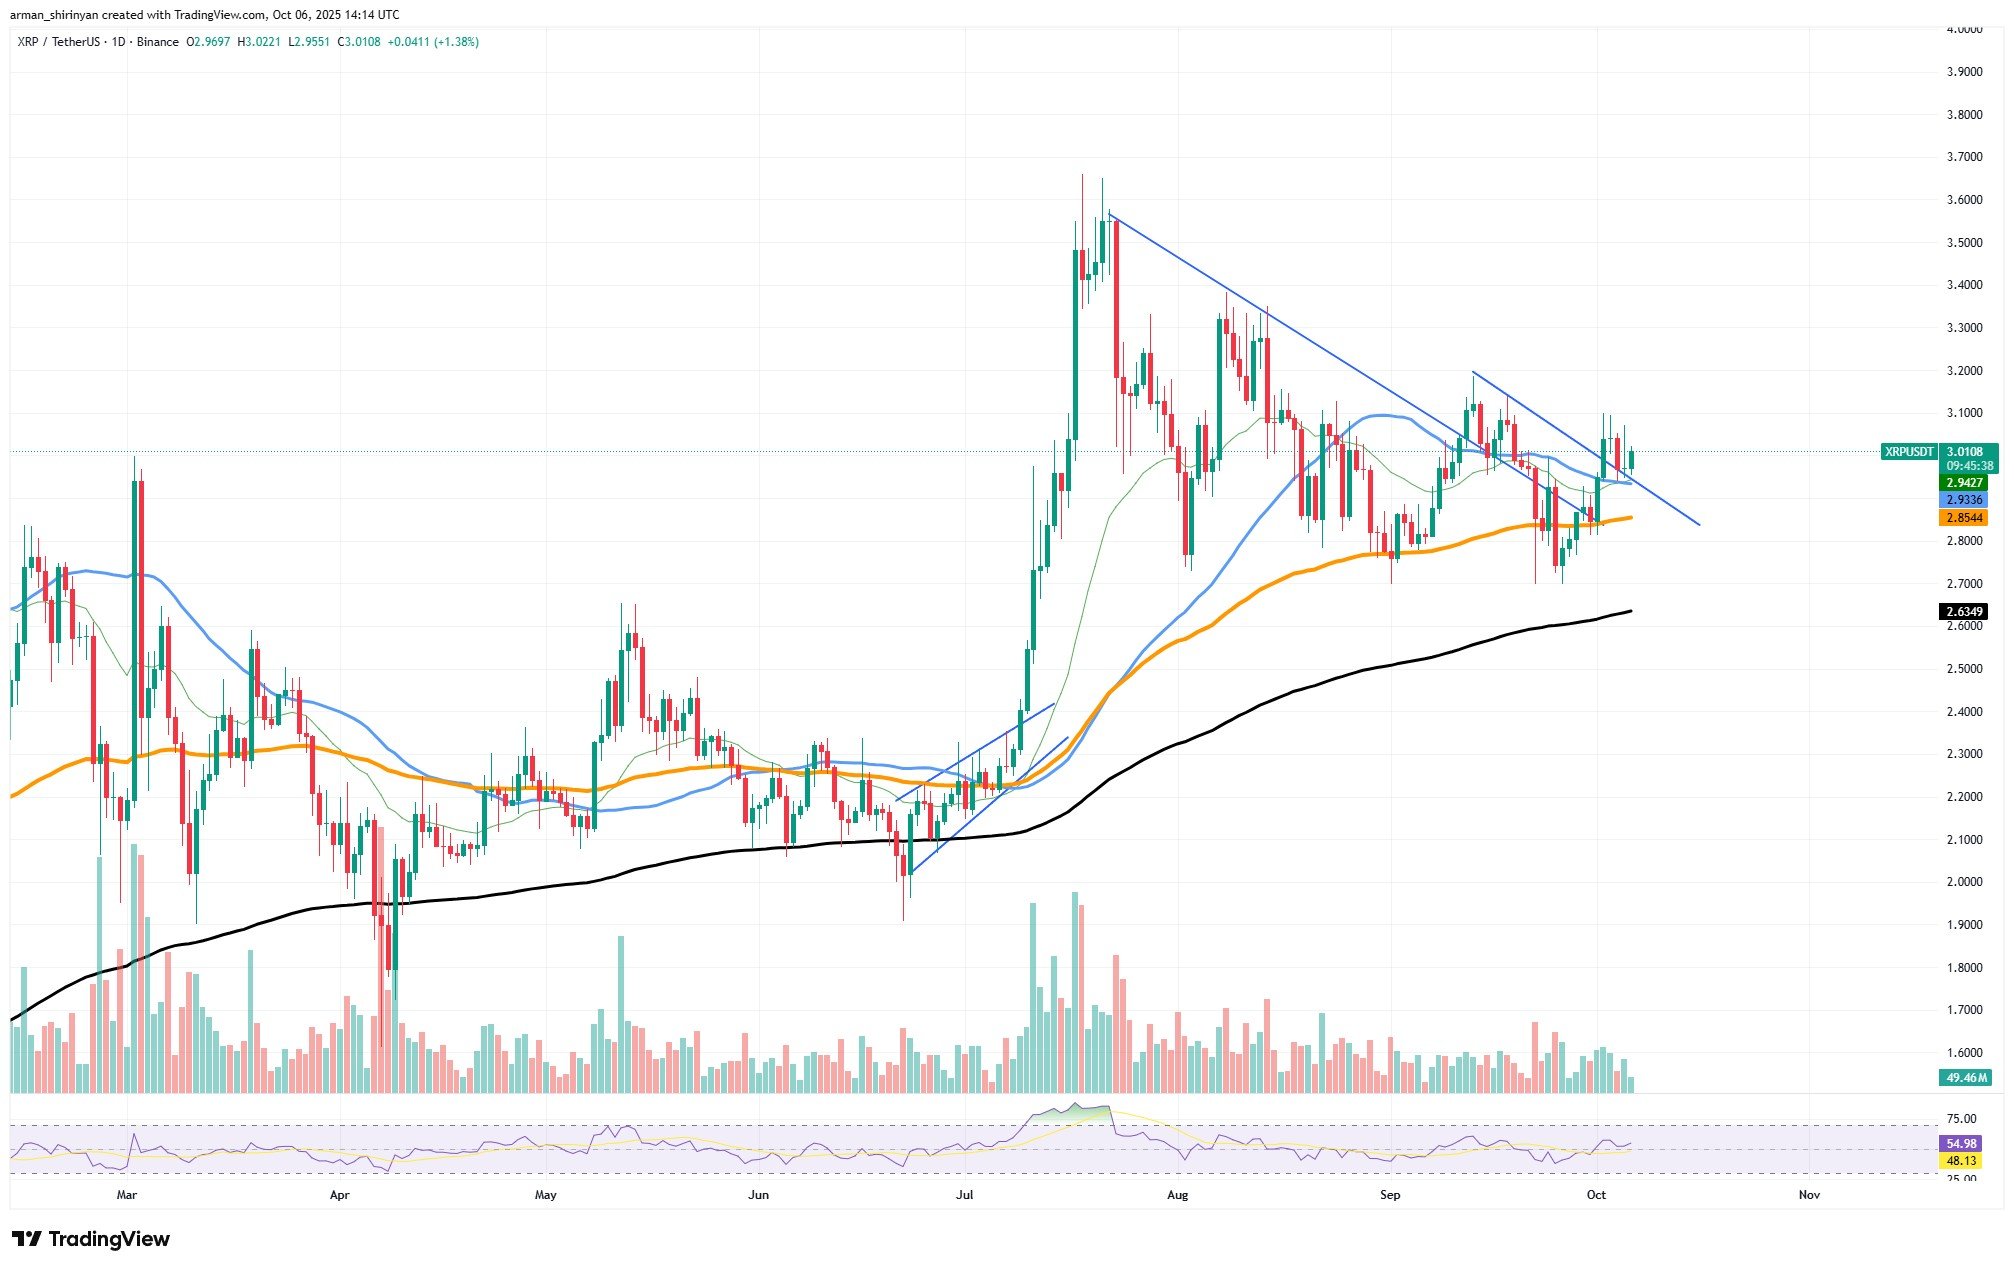
The market may be rejecting further bullish continuation, as the $3 threshold has now served as resistance three times. If the trend is confirmed, a close below this level might lead to a further decline toward the $2.80 or even $2.60 support zones, which are where the 100-day and 200-day moving averages converge.
Indicators of momentum at the moment support this prediction as well. After a brief spike, trading volume seems to be cooling off, and the RSI is neutral but flattening, suggesting a weakening in buying strength. This suggests that bulls are losing ground and that the market may be getting ready for a period of retracement.
The likelihood of a local top forming is still high unless XRP achieves a clear break above $3.10-$3.20, with strong volume confirmation. A decline below $2.80 would probably increase selling pressure if the head and shoulders pattern materializes, driving the asset toward its longer-term moving average support near $2.60, which has historically been a rebound point.
To put it briefly, the technical setup of XRP suggests that the recent recovery rally may be coming to an end. The bearish case is strengthened by the third consecutive denial at $3.
Ethereum phase change
As it consolidates just below the $4,500 level, which has served as both resistance and a psychological barrier in recent months, Ethereum looks to be entering a decisive phase.
Following a recovery from the $4,000-$4,100 support range, the asset has been rising steadily, and its most recent move indicates a clear intention to breach the crucial resistance level. ETH is currently trading close to $4,550, putting it up against the upper limit of a symmetrical triangle that has developed over the previous few weeks. Because it indicates a time of accumulation and equilibrium between buyers and sellers prior to the next significant move, this consolidation is a positive indication for the market.
The bullish outlook is strengthened by technical indicators that are trending upward, such as the 50-day and 100-day moving averages. Ethereum could confirm a breakout that could push the asset toward $5,000, which is in line with its previous all-time high zone, if it closes above the $4,500-$4,600 range with convincing volume. Based on the current market structure and indicators of recovering momentum, Ethereum appears to be steadily regaining strength and setting itself up for future gains.
Conversely, if momentum fails to hold above $4,500, the current rally on Bitcoin may cool off, and a short-term retest of support may occur at $4,300 or even $4,000. Higher lows have been steadily forming since late September, though, and the overall sentiment is still positive. Ethereum's consolidation now appears to be more of a springboard than a sign of exhaustion.
A strong breakout could ultimately push ETH toward the $5,000 mark, which many traders view as the next logical step in the ongoing recovery phase, provided market conditions hold and volume keeps increasing.
Bitcoin's push
After its recent surge, Bitcoin seems to be waning, which has some investors worried that the long-awaited push toward $150,000 might not come as soon as they had hoped.
The momentum behind Bitcoin appears to be weakening after a spectacular surge that propelled the largest cryptocurrency in the world over the $120,000 mark. Shorter time frames are showing early indications of exhaustion. A zone that usually precedes local pullbacks or at least periods of sideways consolidation, the daily RSI (Relative Strength Index) is currently above 70, indicating an overbought situation. Additionally, the trading volume has begun to decrease in comparison to the days of the previous surge, which may indicate that the buying pressure is waning.
Although its short-term strength seems stretched, Bitcoin’s technical structure is still bullish overall, supported by the 50- and 100-day moving averages. Before attempting another leg higher, Bitcoin may test support levels close to $120,000 or $115,000 due to the lack of fresh inflows and waning momentum. From a fundamental perspective, the long-term outlook is still supported by enthusiasm for institutional accumulation and ETF inflows.
Once early gains are made and the momentum slows, sentiment-driven rallies, however, frequently find it difficult to maintain their course. Now, traders are keeping an eye on whether Bitcoin can hold steady at its current levels without igniting a wider correction that might erode bullish sentiment.
Though it is becoming more obvious that new catalysts like resurgent institutional demand or macroeconomic shifts favoring riskier assets will be needed for the move, the path toward $150,000 may still be open if Bitcoin is able to consolidate above $120,000. Investors may need to lower their expectations for an instant breakout to new highs if momentum does not pick up soon.
 Dan Burgin