
Disclaimer: The opinions expressed by our writers are their own and do not represent the views of U.Today. The financial and market information provided on U.Today is intended for informational purposes only. U.Today is not liable for any financial losses incurred while trading cryptocurrencies. Conduct your own research by contacting financial experts before making any investment decisions. We believe that all content is accurate as of the date of publication, but certain offers mentioned may no longer be available.
The market's structure is far from being bullish, but we might finally enter a proper, predictable downtrend, as assets like XRP show a clear price tendency. Meanwhile, Bitcoin risks losing six digits, while Dogecoin shows unimpressive performance from bears.
Bitcoin's major risk
Following a severe decline that eliminated weeks of bullish positioning Bitcoin is currently trading at about $95,500. The price is now below all of the major moving averages including the 50-day 100-day and 200-day and the most recent attempt at a bounce has already stalled indicating a clear structural shift on the chart.
The clock is running out for any realistic chance to reach six-digit territory and the market is at a point where the next directional move will probably determine the remainder of the cycle. The drawdown itself is not the issue the context is. The $100,000 psychological level which was supposed to act as a new baseline earlier this year is now firmly below Bitcoin. It became resistant instead.
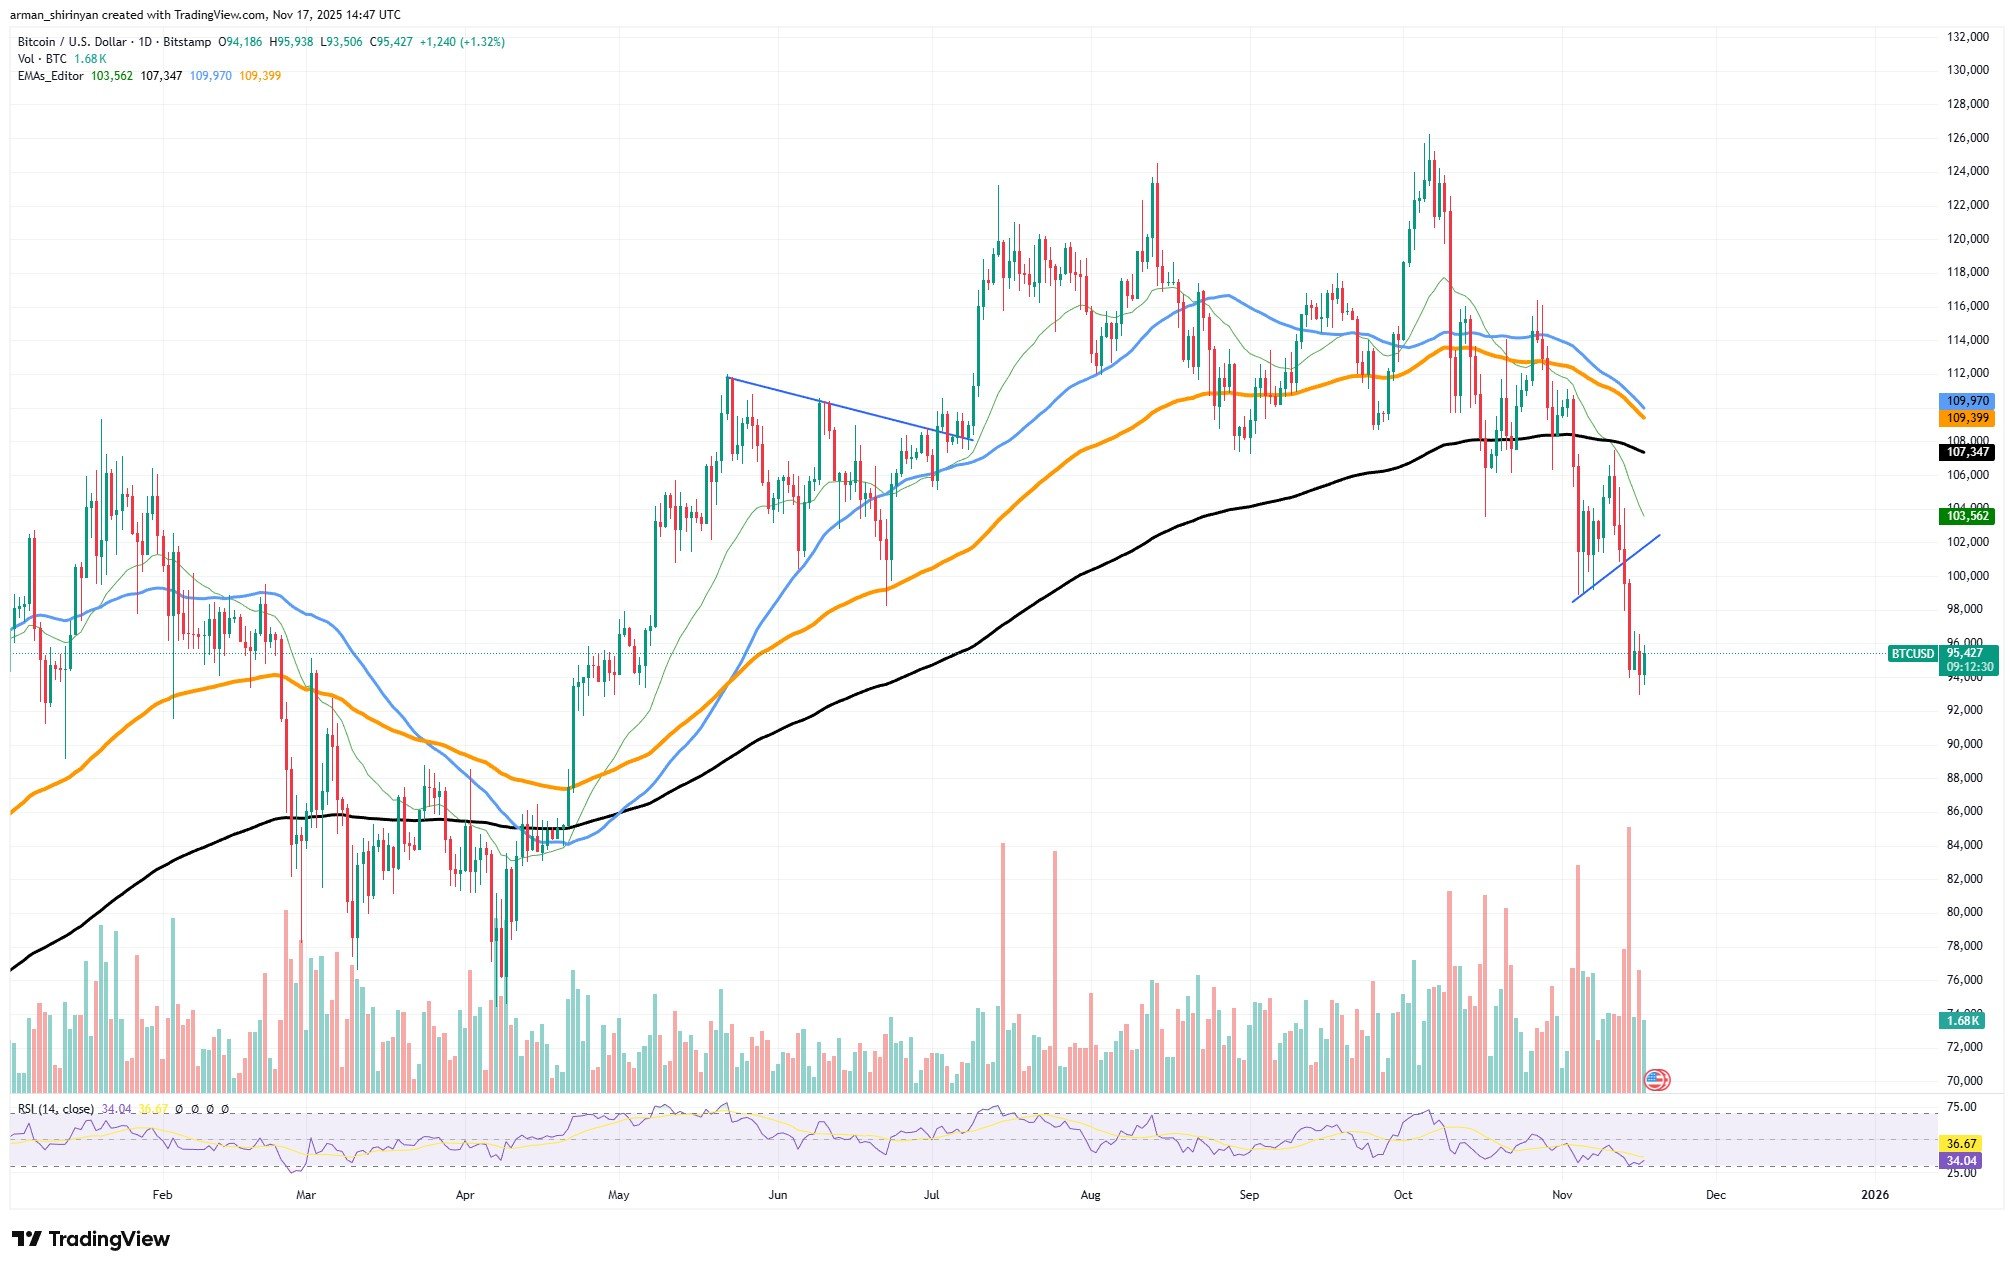
This is no longer a transient decline, because the 50-day and 200-day averages are declining. It's a change in trend and if bulls don't quickly recover important levels the next stage might involve a protracted grind below $100,000.
The RSI is currently close to 34 indicating strong sell pressure but not total capitulation. As a result Bitcoin may decline. Red candle volume has also increased suggesting forced selling rather than accumulation. The last time this occurred it took weeks for Bitcoin to stabilize and this situation appears to be comparable if not worse.
Bitcoin needs to close above the 200-day moving average and break back above $105,000 in order to have any chance of reaching six figures during this cycle.
The six-digit narrative would then require strength to return to $112,000-$115,000. However investors should get ready for a situation where triple digits become the exception rather than the rule if Bitcoin is unable to swiftly recover $100,000 particularly with weekly closes trending downward.
In 2026, the market would probably move into a macro lower high eventually aiming for the $80,000-$85,000 range before potentially drifting toward the 200-week moving average.
XRP settles down
At last, XRP’s price structure has settled into a clear descending channel which is no longer unclear. Following weeks of erratic movements and false starts, the chart now displays a distinct pattern that helps traders understand what's going on and where it might go next.
Since early October, the price has been making lower highs and lower lows, and the descending channel is now clearly visible. Because it offers structure rather than chaos, this is important.

The bias remains bearish as long as XRP stays within this channel, and any bounce within this trend should be treated with suspicion until it is demonstrated otherwise. The problem is highlighted by the moving averages.
The 50-day, 100-day, and 200-day MAs are all below XRP’s current price, indicating a decline. There isn’t a healthy uptrend for any asset in that posture.
Downside risk is still present because the RSI, around 44, indicates that there is still space to drop before reaching full capitulation levels. The good news is that violent reversals frequently occur at the end of descending channels.
A distinct shift would be indicated if the price breaks above the upper channel line with volume, or if the lower boundary is tested and holds. In that case, XRP might recover $2.70 and begin to move back toward the mid-$3s.
Dogecoin bears are weak
Dogecoin has been declining for weeks, but the volume, or rather the absence of it, is the most telling aspect of this trend rather than the price. The fact that DOGE is drifting lower on decreasing volume indicates that this is not a selloff motivated by panic. It is apathy.
In terms of price, DOGE has remained below all significant moving averages. The asset is being compressed, and a clear bearish structure is confirmed because the 50-day, 100-day, and 200-day MAs are all above the current price levels.

There isn’t much momentum, and even the most recent candles don’t indicate that buyers are desperate to make up lost ground. RSI is bearish but not oversold at about 40.
However, this decline differs from a brutal capitulation due to its volume. Neither sell pressure nor fear-driven exits have sharply increased. DOGE is not collapsing, rather it is relaxing.
Additionally, historically low-volume downtrends frequently indicate one of two things: either the market is quietly losing interest just before a reversal, or there is a gradual bleed toward a collapse. The latter is a plausible scenario in the case of Dogecoin.
It is evident from the low volume that sellers are not actively dumping. Additionally, it indicates that whales are not further depressing the market. This is not like the loud, frantic blow-offs that are typical of DOGE’s major price tops.
DOGE is currently trading close to the $0.17-$0.16 range. It might start building the foundation for its next move if it can maintain this region and prevent a breakdown toward $0.14. Volume must return for that to occur, but it must be a steady, controlled inflow from traders positioning ahead of a change in the tone of the market rather than a huge explosion driven by memes.
 Dan Burgin
 U.Today Editorial Team