Disclaimer: The opinions expressed by our writers are their own and do not represent the views of U.Today. The financial and market information provided on U.Today is intended for informational purposes only. U.Today is not liable for any financial losses incurred while trading cryptocurrencies. Conduct your own research by contacting financial experts before making any investment decisions. We believe that all content is accurate as of the date of publication, but certain offers mentioned may no longer be available.
The SHIB chart painfully shows that its recent price action is a combination of short-term relief and long-term structural weakness. Following a string of lower lows, the recent candles around the $0.0000079-$0.0000081 range indicate that SHIB is attempting to stabilize, or at the very least, slow down the bleeding.
Volume grows
Volume supports that interpretation: trading activity has exploded in a panic, which typically occurs during full-scale capitulation despite the sell-off. Instead, volume is moderate, suggesting either exhaustion from sellers or a temporary pause in the trend. Let's face it, though: nothing here screams miracle reversal.
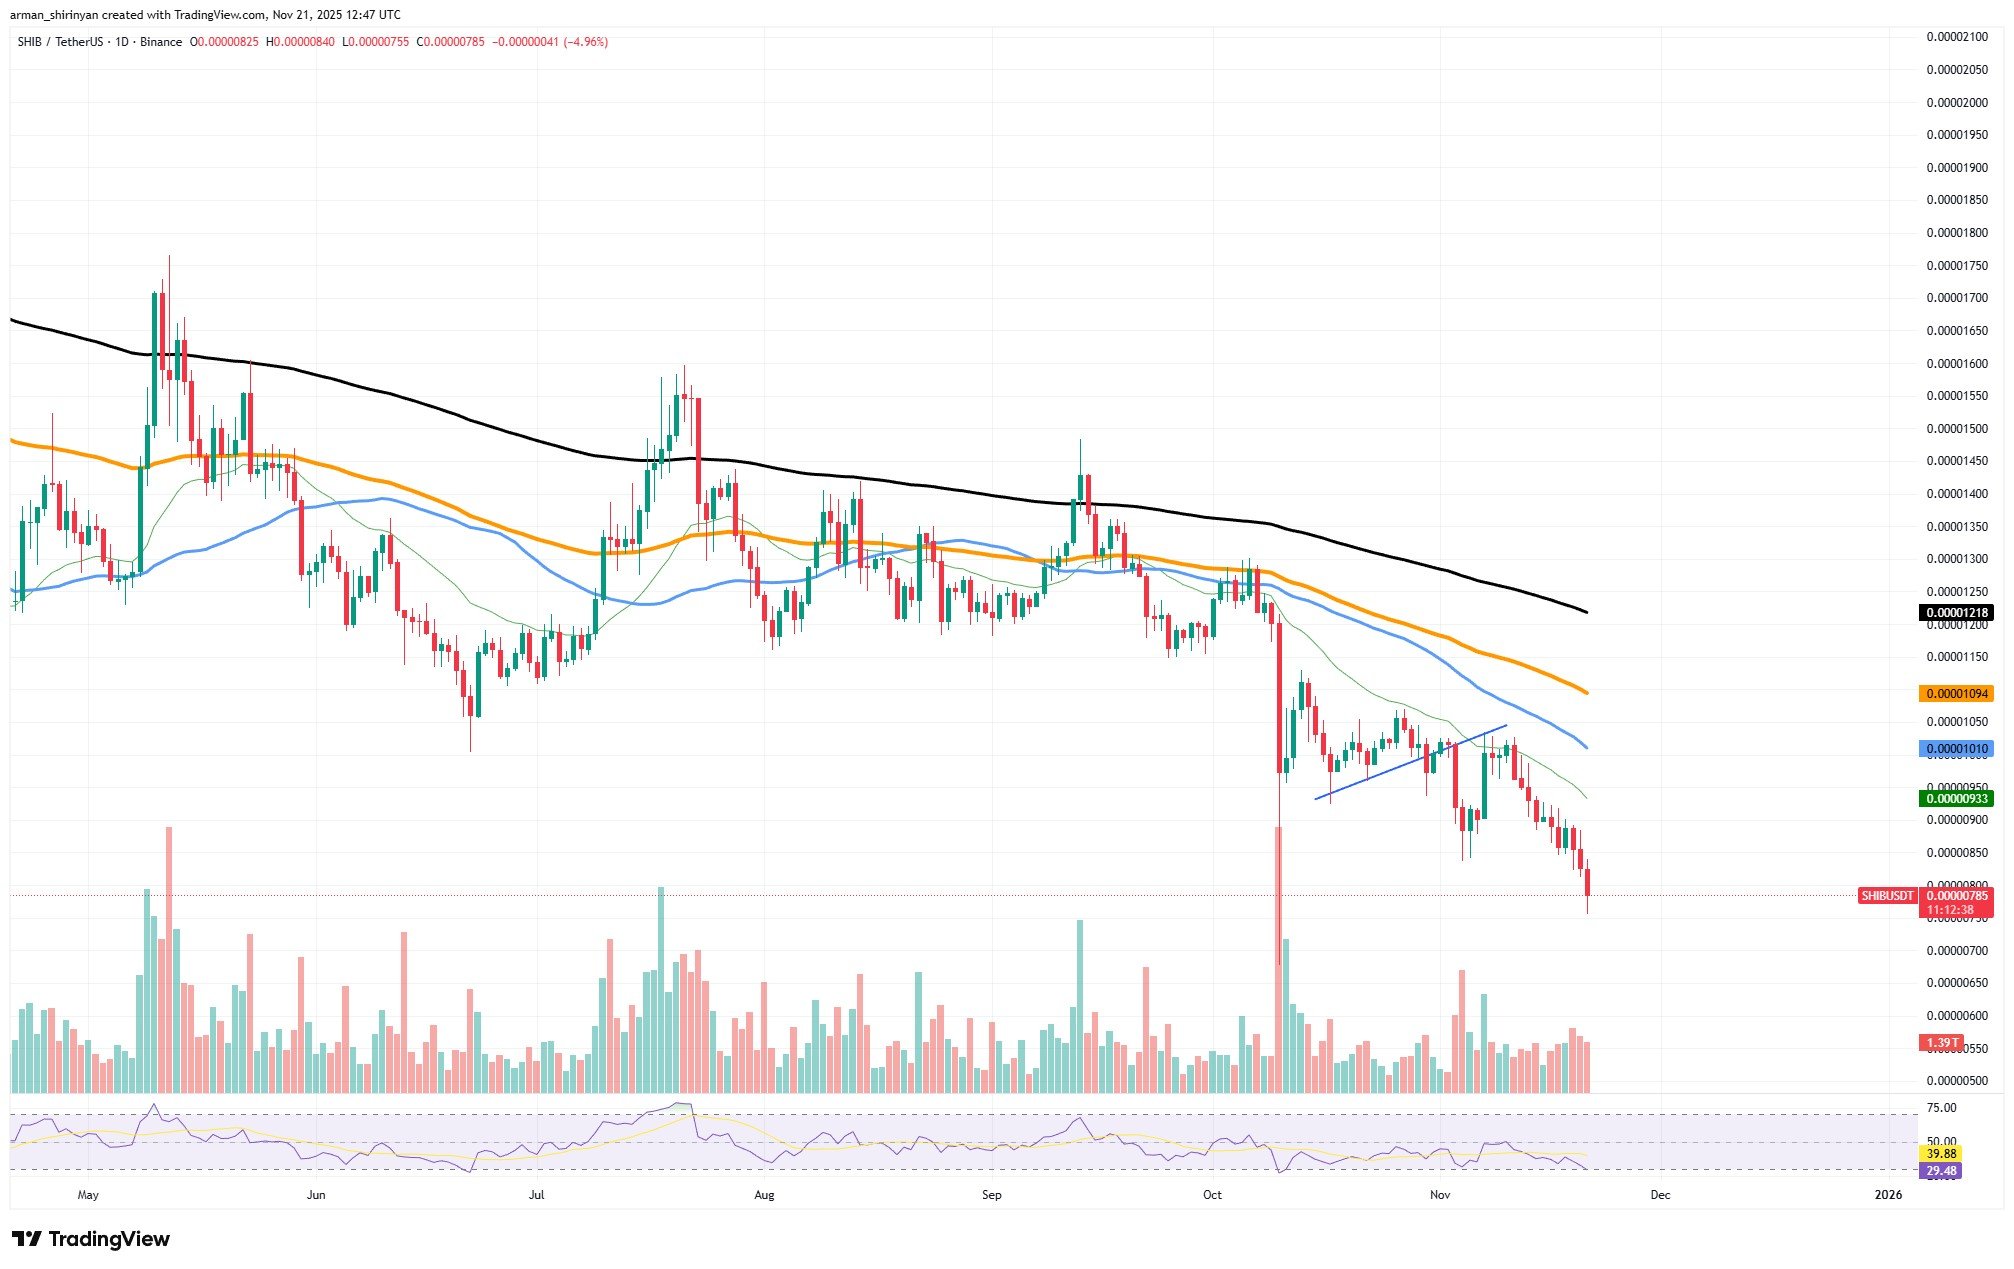
The 50, 100 and 200-day lines are among the major moving averages that Shiba Inu is still far below. All of them are sloping downward, which tells you everything you need to know about the broader trend. Rallies are capped early in this type of structure because every bounce encounters overhead resistance right away. The market is aware of these levels, and SHIB has not demonstrated the strength to overcome them.
What can save SHIB?
Right now, the only truly positive aspect is the potential for the current level to serve as a temporary save zone. Some passive buyers may still view this range as fair value because SHIB has historically spent a lot of time trading around this price. This may help slow the decline sufficiently for a relief rally, which is a bounce rather than a reversal of the trend. If that occurs, the price may return to $0.0000088 or $0.0000090 before experiencing further difficulties.
However, SHIB has not established a solid base below this level, so if the current support fails, the next landing zone is lower. "Oversold" does not imply a reversal, rather, it simply indicates that the selling has been aggressive. The RSI hovering around the oversold boundary suggests that momentum is stretched. In other words, it is unrealistic to expect a complete recovery or an abrupt bullish wave, but SHIB can certainly pause here and even rebound.
Technically speaking, the asset is still in a strong downward trend, and rallies will soon stall unless volume turns sharply positive and the price begins to recover lost moving averages. Until SHIB demonstrates otherwise — which it has not done thus far — investors should consider any bounce to be transient.
 Dan Burgin
 U.Today Editorial Team