Disclaimer: The opinions expressed by our writers are their own and do not represent the views of U.Today. The financial and market information provided on U.Today is intended for informational purposes only. U.Today is not liable for any financial losses incurred while trading cryptocurrencies. Conduct your own research by contacting financial experts before making any investment decisions. We believe that all content is accurate as of the date of publication, but certain offers mentioned may no longer be available.
Shiba Inu (SHIB) has reached a point where the charts are giving us a clear picture of what's going on for the once popular meme coin. The price of SHIB, according to Trading View, sits near $0.00000867, and all three major time frames — daily, weekly, monthly — now point to the same conclusion: SHIB is currently at the lower end of its range, and the next move will decide if this is just a correction or if it will go deeper.
If you look at the daily chart, SHIB trades below the middle Bollinger Band at about $0.00000950, and every attempt to climb toward the upper band around $0.00001044 has failed. This shows a market that cannot break through the resistance, but it is not collapsing either.
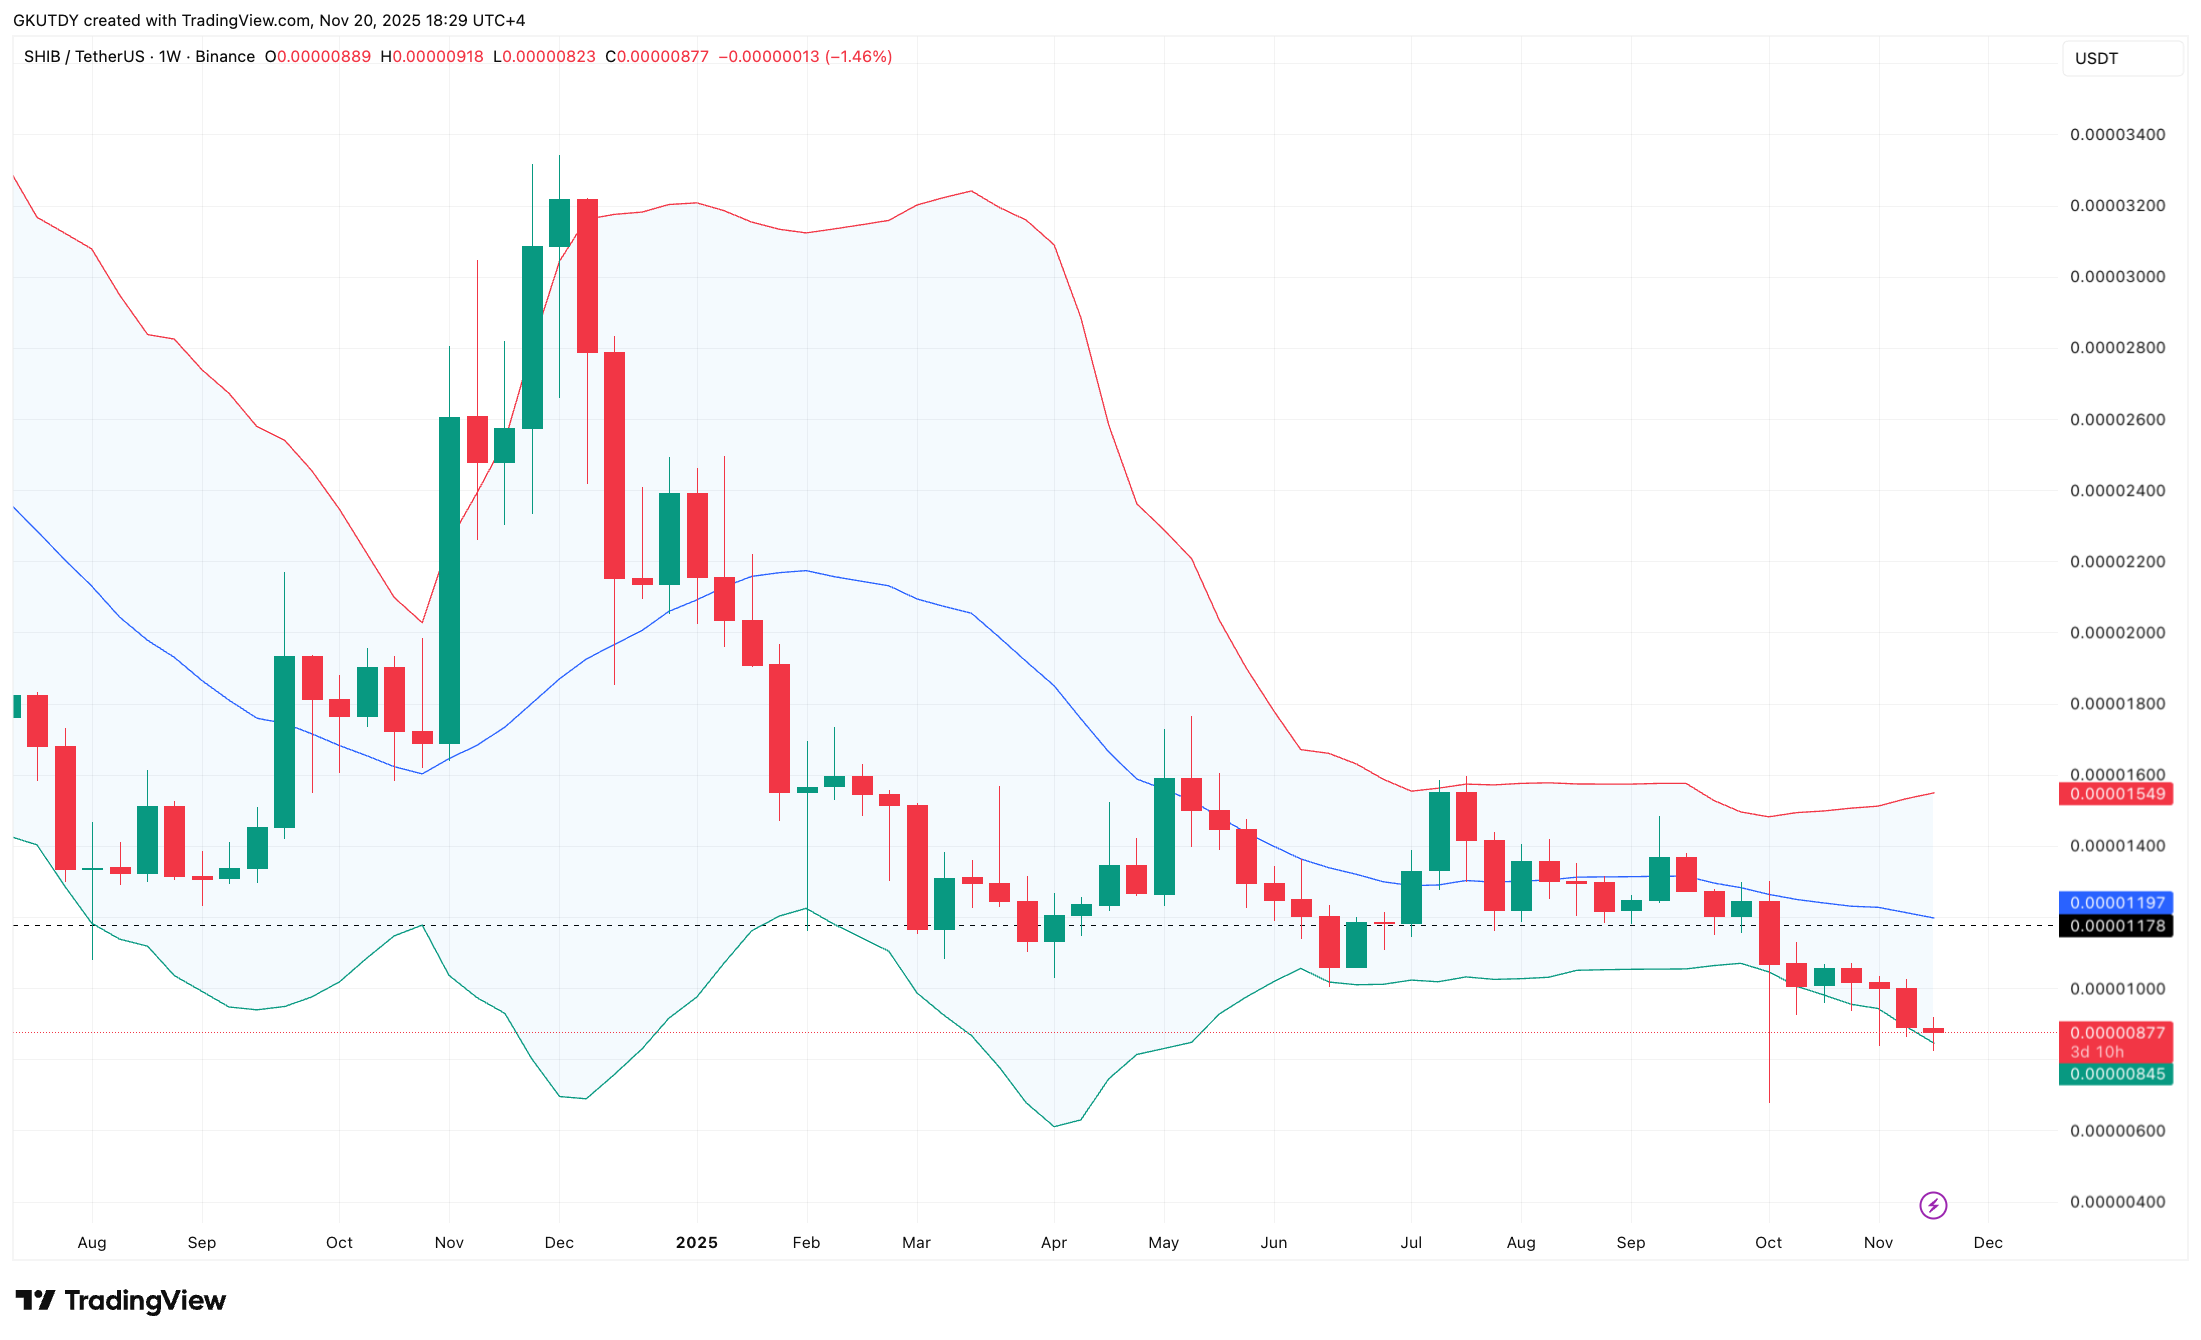
The weekly chart explains why the situation feels tighter. The Shiba Inu coin has been stuck under the weekly midband at about $0.00001197 for months, and the price now sits just above the weekly lower band near $0.00000843. When an asset sits this close to the lower band without breaching it, it usually signals exhaustion rather than a trend break.
It also shows that buyers are no longer in control.
Can SHIB survive a 30% drawdown?
The monthly chart sets the full boundary. The midband is high at about $0.00001580. That level is the best case path, and it would require a move of more than 80% from current pricing to flip SHIB back into long-term bullish form.
The lower band is at about $0.00000599, and that is the worst-case slide, a drop of around 31% that would send SHIB back to its early days' support.
The crossroads are as follows: if the SHIB price moves back above the weekly midband, it will continue rising, but if it goes below the monthly lower band, it will confirm the other direction.
 Dan Burgin
 U.Today Editorial Team