It looks like the cryptocurrency market is not going to face any correction, as Bitcoin, along with the top 10 coins, is going up. Only the price of Binance Coin has dropped by around 0.5% over the past 24 hours when the biggest gainer is BTC, whose rate has increased by more than 4%. The ongoing market growth has affected the total market capitalization, which has gone up by $10 bln over the previous day.
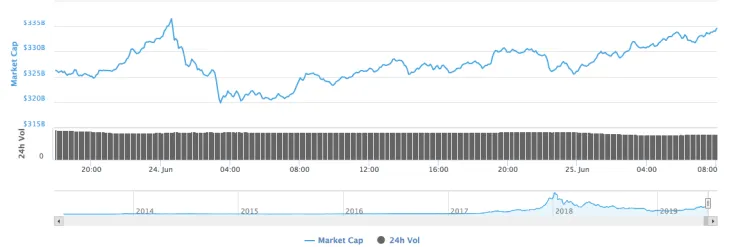
While Bitcoin is moving north faster than other coins, its dominance rate is approaching 60% and now makes up 59.7%.
BTC/USD
Currently, Bitcoin is not following our earlier scenario, as the quotes are located above $11,000. While trading above $10,000, the main cryptocurrency has not faced a correction, suggesting a possible rollback soon.
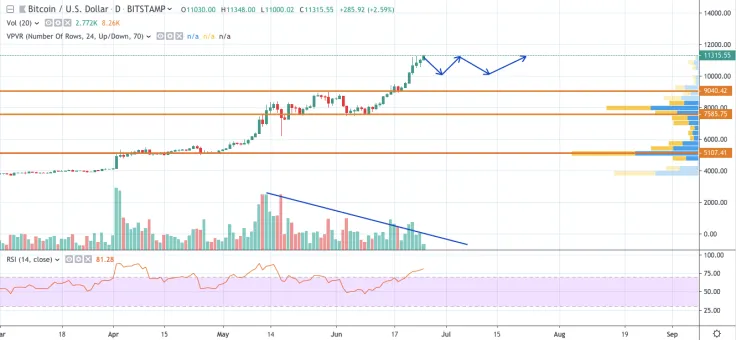
On the daily chart, one can expect a sideways trend and a fix above $10,000. Such a movement is confirmed by the trading volume, which is in stagnation now. What is more, the RSI indicator is overbought, rejecting any movement higher $12,000 without a rollback.
The price of BTC is trading at $11,310 at the time of writing.
ETH/USD
ETH quotes also moved higher, catching up behind Bitcoin; however, the leading altcoin is losing its value in correlation to BTC.
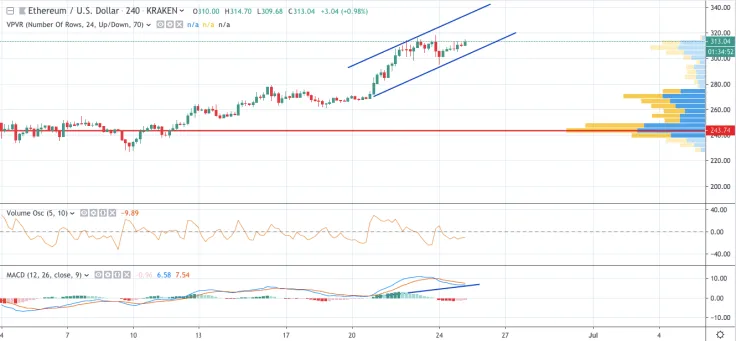
According to the 4-hour chart, bulls are not going to give the baton to bears. Comparing Ethereum with Bitcoin, the second most popular crypto has lost around 50% of its price over the last year. Respectively, the current rate is not the ceiling, and the asset has strength to rise higher. Thus, the MACD indicator confirms the bullish tendencies, suggesting the growth up to $320 until the end of June.
The price of ETH is trading at $313.15 at the time of writing.
XRP/USD
Ripple is moving according to our forecast yesterday; its rate has increased by 1.6% over the last 24 hours.
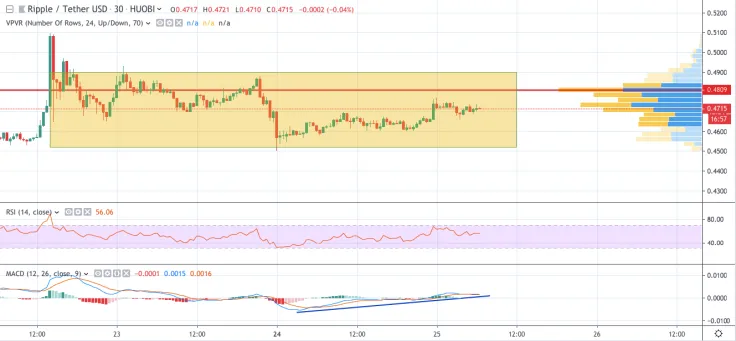
On the 30 minute graph, Ripple is likely to locate in a sideways trend in the range between $0.4520 and $0.49. The technical patterns back such price movements of XRP. Mainly, the MACD indicator is near its local maxima, and RSI remains neutral. While the asset is above $0.45, there are no prerequisites for a decline.
The price of XRP is trading at $0.4715 at the time of writing.
 Dan Burgin