
Disclaimer: The opinions expressed by our writers are their own and do not represent the views of U.Today. The financial and market information provided on U.Today is intended for informational purposes only. U.Today is not liable for any financial losses incurred while trading cryptocurrencies. Conduct your own research by contacting financial experts before making any investment decisions. We believe that all content is accurate as of the date of publication, but certain offers mentioned may no longer be available.
Many assets are “squeezed” within the framework of 'triangles' - buyers have not been able to break through the next resistance levels. The reluctance of the market to move up may indicate strong pressure from the bears.
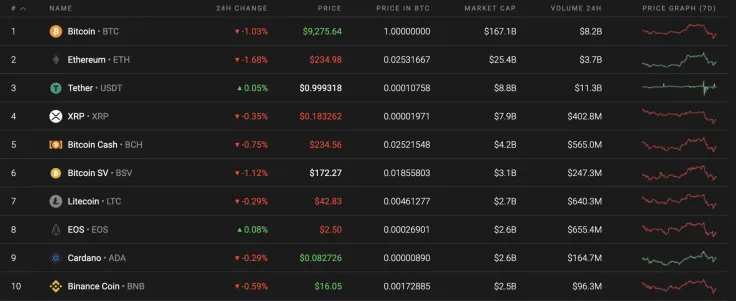
The crucial data for Bitcoin (BTC), Ethereum (ETH), Bitcoin Cash (BCH), Litecoin (LTC), and EOS.
|
Name |
Ticker Advertisement
|
Market Cap |
Price |
Volume (24h) Advertisement
|
Change (24h) |
|
Bitcoin |
BTC |
$169,470,341,845 |
$9,203.25 |
$20,418,903,773 |
-1.50% |
|
Ethereum |
ETH |
$26,002,915,618 |
$233.22 |
$8,396,732,861 |
-2.58% |
|
Bitcoin Cash |
BCH |
$4,286,525,021 |
$232.40 |
$1,239,949,635 |
-1.49% |
|
EOS |
EOS |
$2,313,807,318 |
$2.48 |
$1,215,696,132 |
-0.73% |
|
Litecoin |
LTC |
$2,752,716,389 |
$42.42 |
$1,444,178,028 |
-1.22% |
BTC/USD
Bitcoin (BTC) quotes continue to remain under an important resistance level, the breakdown of which will indicate steady continued growth. But while the price is below this level, we should not rule out a fall to the next important support - $6,320. An additional signal in favor of this option is the test of the fast resistance line on the RSI indicator.

A confirmation of the downward movement will be a breakdown of the lower border of the Bollinger Bands indicator and the price holding below $8,500.
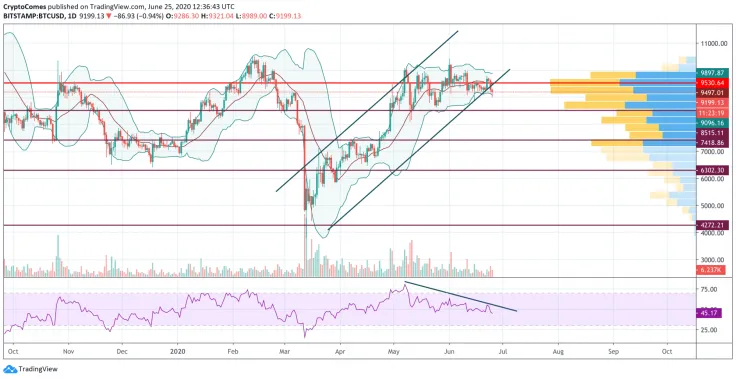
Buyers could see a rise if there is a breakdown of the resistance and the price holds above $10,635, in which case it will continue to rise to the first target at $11,900.
Bitcoin is trading at $9,187 at press time.
ETH/USD
On the daily chart, Ethereum (ETH) quotes continue to stubbornly test the upper border of the downward channel. In case of a breakdown and consolidation of the price above the $255, we can expect continued growth to the level of $287.
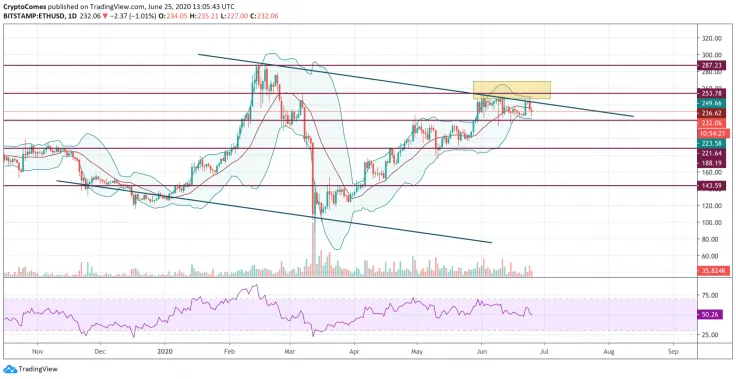
A signal in favor of ETH/USD falling to $220 would be a rebound from the resistance line on the RSI indicator. As we can see, its previous test was accompanied by a strong drop in prices, but after the decline, it again returned to the upper border of the Bollinger Bands indicator. This behavior of the quotes indicates pressure from buyers.
Ethereum is trading at $232.44 at press time.
BCH/USD
Bitcoin Cash (BCH) quotes on the daily chart have held below the middle line of the Bollinger Bands, which indicates strong pressure from the bears. The asset is still squeezed under the 'Triangle' model.
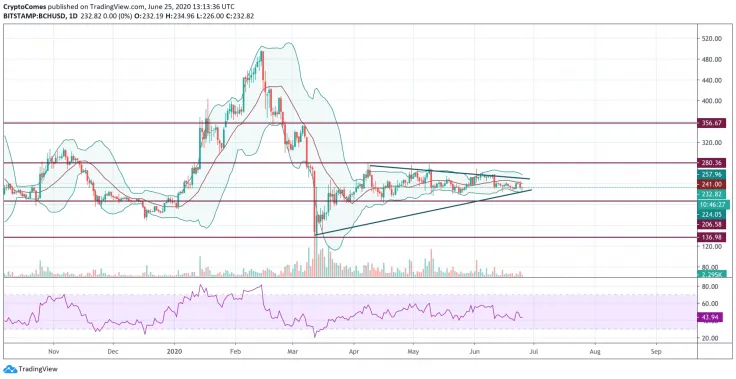
Most likely, we can expect a breakdown of the lower border of the model and a continued fall in quotations to $136. In favor of this scenario, a rebound from the resistance line on the RSI indicator will occur. Otherwise, a price drop could occur if there is a breakdown of the upper boundary of the Triangle model with the price holding above $280. Here, the goal of growth would be the level of $356.
Bitcoin Cash is trading at $232.82 at press time.
EOS/USD
The price of EOS on the daily chart is still within the 'triangle', similar to that of Bitcoin Cash (BCH). A strong signal in favor of a fall with a breakdown of the lower boundary of the model is a test of the trend line on the RSI indicator. A confirmation of the decline would be a breakdown of the level of $2.24 - then we can safely assume a continuation of the movement to $1.32.
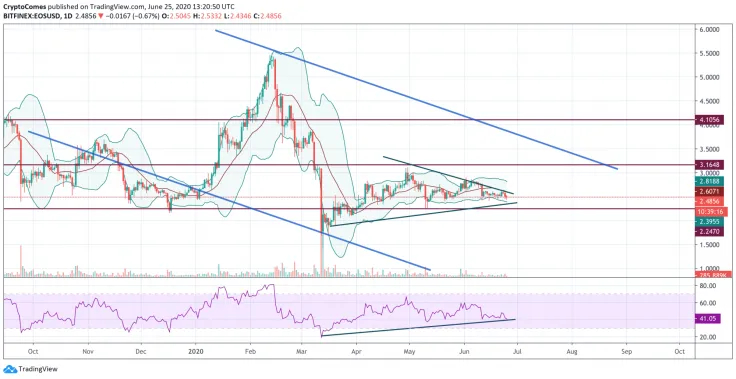
Cancellation of the negative option for buyers will be a breakdown of the resistance and the price holding above the level of $3.16, which will confirm that the price will likely overcome the upper boundary of the model and ensure the continuation of the rise to the level of $4.10.
EOS is trading at $2.48 at press time.
LTC/USD
On the 4H chart, the potential for the formation of a head and shoulders reversal pattern is visible. The completion of the formation of the right shoulder of the model can be expected at $46. From this, the asset could show a strong drop to the level of $38 and below.
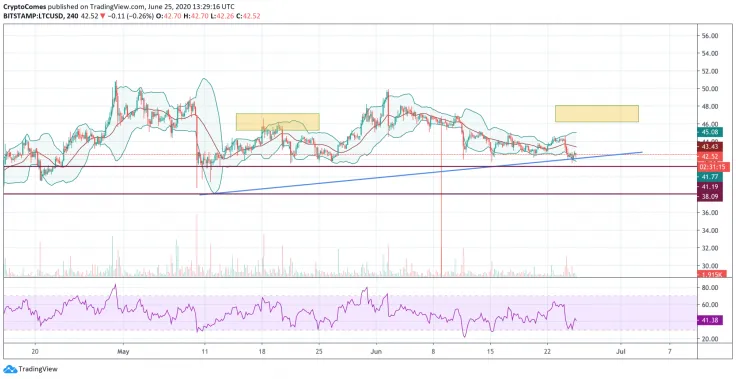
An additional signal in favor of the described option will be a test of the resistance line on the RSI indicator, and confirmation will be a breakdown of the neckline of the reversal model and the price holding below $41.
Litecoin is trading at $42.50 at press time.
 Dan Burgin