Bitcoin has recently made a few considerable moves: it overcame $4,000 threshold and then got stuck below this sum. What should we expect next? Will BTC hit the $4,100 mark again, or is it doomed to fall? TradingView experts share their opinions and Bitcoin price predictions.
BTC will move between $3000 and $4,500 this year

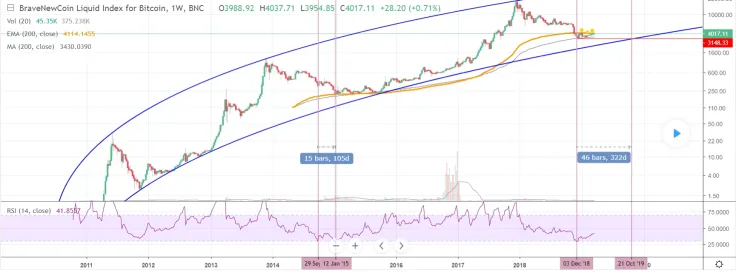
Bitcoin price chart from MagicPoopCannon
If we look at the recent week analysis on BLX log chart, we can see that BTC has been on a steady march higher for the past few weeks. However, we are currently running into the weekly 200 EMA (in orange). Bitcoin failed to surpass this overhead resistance the last time we ran into it, which was after the current low was put in during December. Now, we are retesting that level to see if it will continue to provide resistance.
According to MagicPoopCanon, BTC is likely to stay resistive, and BTC will move sideways for some time below the weekly 200 EMA. It will test 200 MA for support. Since we’re only recovering from the bear market, it is more likely that we will fall to retest support, before we breakout above powerful resistance, which is the weekly 200 EMA.
Here’s what the user says about BTC yearly performance:
“Based on these technicals, I think there is a good chance the December low could be revisited in October. That is also why I believe that we will see the market chop sideways between 3000 and 4500 for the majority of the year. However, in the near term, I do expect price to return to the downside, as it will most likely be rejected by resistance at the weekly 200 EMA. Keep in mind, we haven't even come into contact with the rising price arch (in blue) yet. In my view, that will happen at some point, before we enter the next bull market. I don't expect the next bull market to begin until sometime late this year, or early 2020.”
BTC turns the tables

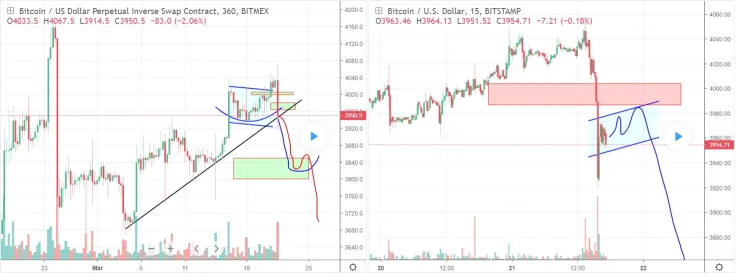
Bitcoin price chart from botje11
Recently, bears took over a large volume of BTC. Volumes dropped seriously, which means bears are struggling with bulls and started their attack when the buying volume was decreasing since the past few candles on the left.
At the moment, we have this big sell candle now, suggesting another wave down is very likely to happen. It’s not clear whether it’s the start of another bear trend (on these time frames) or that this is just a correction from the $3,700/$4,050 rally. A lot will depend on the next drop, the volume of it and the size of it. If the volume is less than the drop we just had, it could stop in that green zone and bounce up and down again. If it's the same or more, we could see a much bigger drop.
If the $4,000 breaks, this bear flag scenario is probably of the table. So you can see this as an ABC, so making wave C down now, or we start a new impulse wave down. Thus, as long as we stay below the $3,980, bears are in full control.
BTC is in the bearish zone

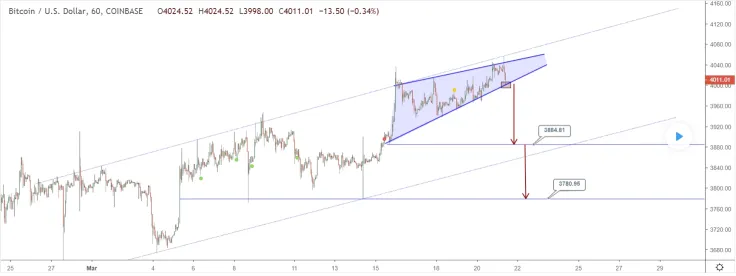
Bitcoin price chart from DianKemala
According to the price chart from DianKemala, the rising wedge has almost broken. If this pattern breaks down, we will have strong bearish movement with target at somewhere between $3,884 to $3,780.
Judging by these forecasts, Bitcoin is very likely to go bearish and probably fall to $3,800 or lower.
BTC/USD price chart from TradingView
Disclaimer: The opinion expressed here is not investment advice – it is provided for informational purposes only. It does not necessarily reflect the opinion of U.Today. Every investment and all trading involves risk, so you should always perform your own research prior to making decisions. We do not recommend investing money you cannot afford to lose.
 Arman Shirinyan
 Alex Dovbnya
 Tomiwabold Olajide
 Caroline Amosun