Disclaimer: The opinions expressed by our writers are their own and do not represent the views of U.Today. The financial and market information provided on U.Today is intended for informational purposes only. U.Today is not liable for any financial losses incurred while trading cryptocurrencies. Conduct your own research by contacting financial experts before making any investment decisions. We believe that all content is accurate as of the date of publication, but certain offers mentioned may no longer be available.
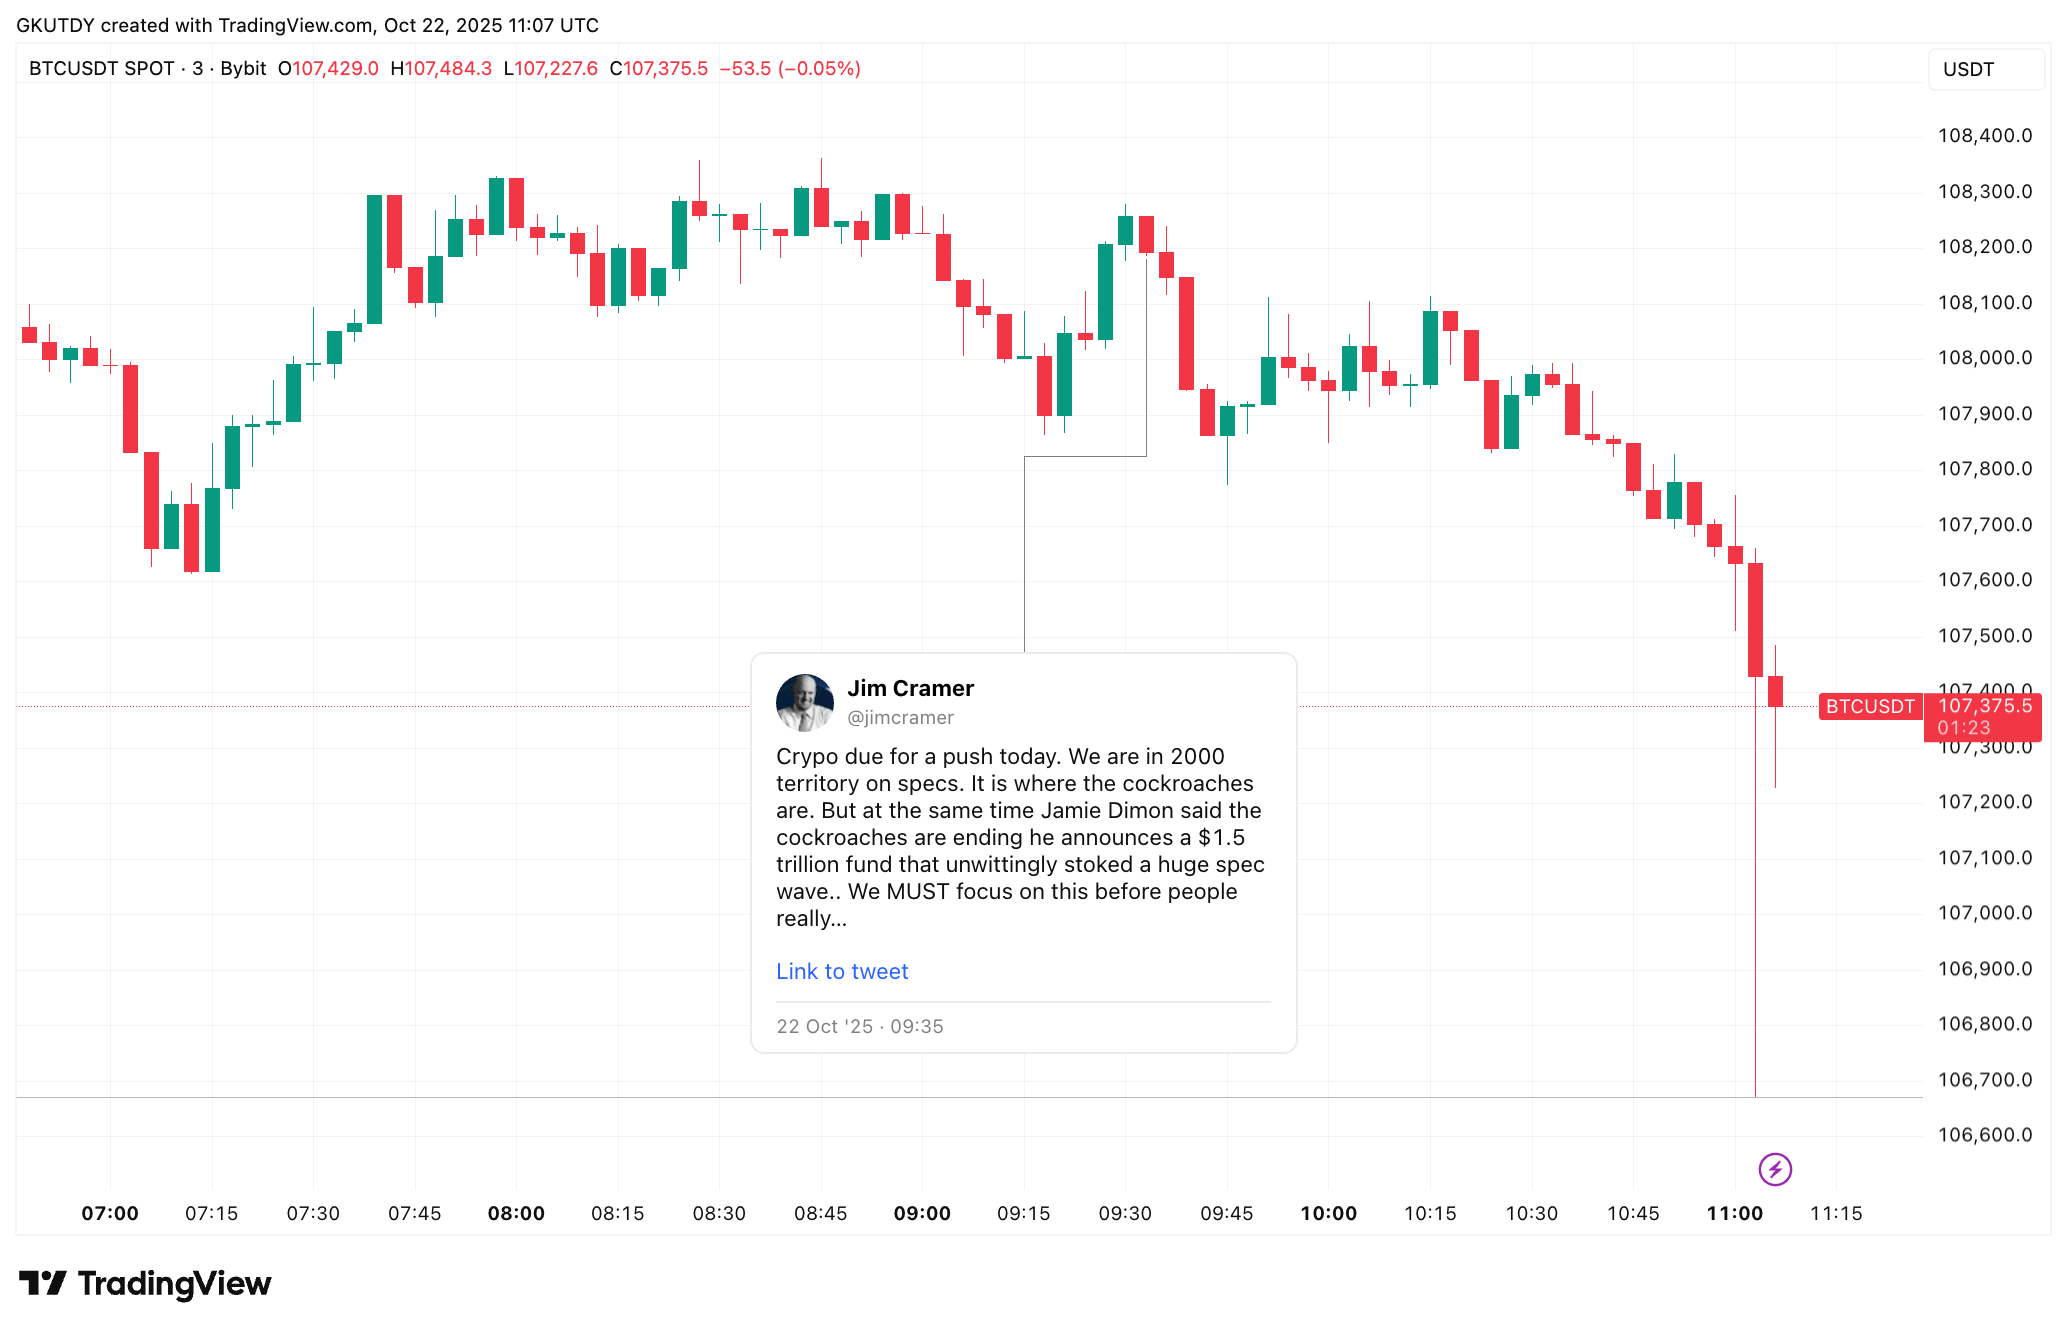
Jim Cramer enjoys the financial market's spotlight on him nearly everyday, breaking headlines with some unconventional and alarming opinions. In the latest X post he just issued, Cramer told his audience that crypto was "due for a push today," while Bitcoin sat at $108,239.
But instead of the move he described, the price action went opposite, and within the hour it slipped to $106,700 BTC, down 1.4%, which is not a collapse in scale but enough to show that the bid was weak, and his call was instantly inverted.

Traders know the pattern — the so-called “Inverse Cramer” trade, where whatever the popular CNBC host frames as the direction ends up pointing the other way.
What did Jim Cramer say today?
Memes aside, Cramer's wording was heavy. He compared the market setup to the 2000 bubble and called it "where the cockroaches are," which means speculation packed into corners where leverage and weak hands are hiding.
It was meant as a warning but still paired with the idea of an upward push, which makes the failure more visible. The market tested his line in real time and rejected it with consecutive red candles. Whether it was a real move remains open to speculation, though.
For now, the Bitcoin chart seems to be clear. In a wide range formed after Oct. 10, $107,800 BTC is the line that needs to hold or sellers will gain the upper hand, while $108,200 BTC is the resistance that bulls have been unable to reclaim.
Between those levels sits the evidence of the day: Cramer called for a push, Bitcoin slipped instead and once again the market gave the “Inverse Cramer” trade more fuel.
 Gamza Khanzadaev
 Arman Shirinyan