Disclaimer: The opinions expressed by our writers are their own and do not represent the views of U.Today. The financial and market information provided on U.Today is intended for informational purposes only. U.Today is not liable for any financial losses incurred while trading cryptocurrencies. Conduct your own research by contacting financial experts before making any investment decisions. We believe that all content is accurate as of the date of publication, but certain offers mentioned may no longer be available.
Bitcoin's print for January shows a 5.53% return for the month. We are closing in on $82,853 and pushing closer to the $80,600 support that has not been tested since the April 2025 cooldown.
But while January 2026 has left a bad taste in everyone's mouths, February could be the recovery month. The reason is not just blindsided bull hope; it is the price history of the cryptocurrency, as per CryptoRank.
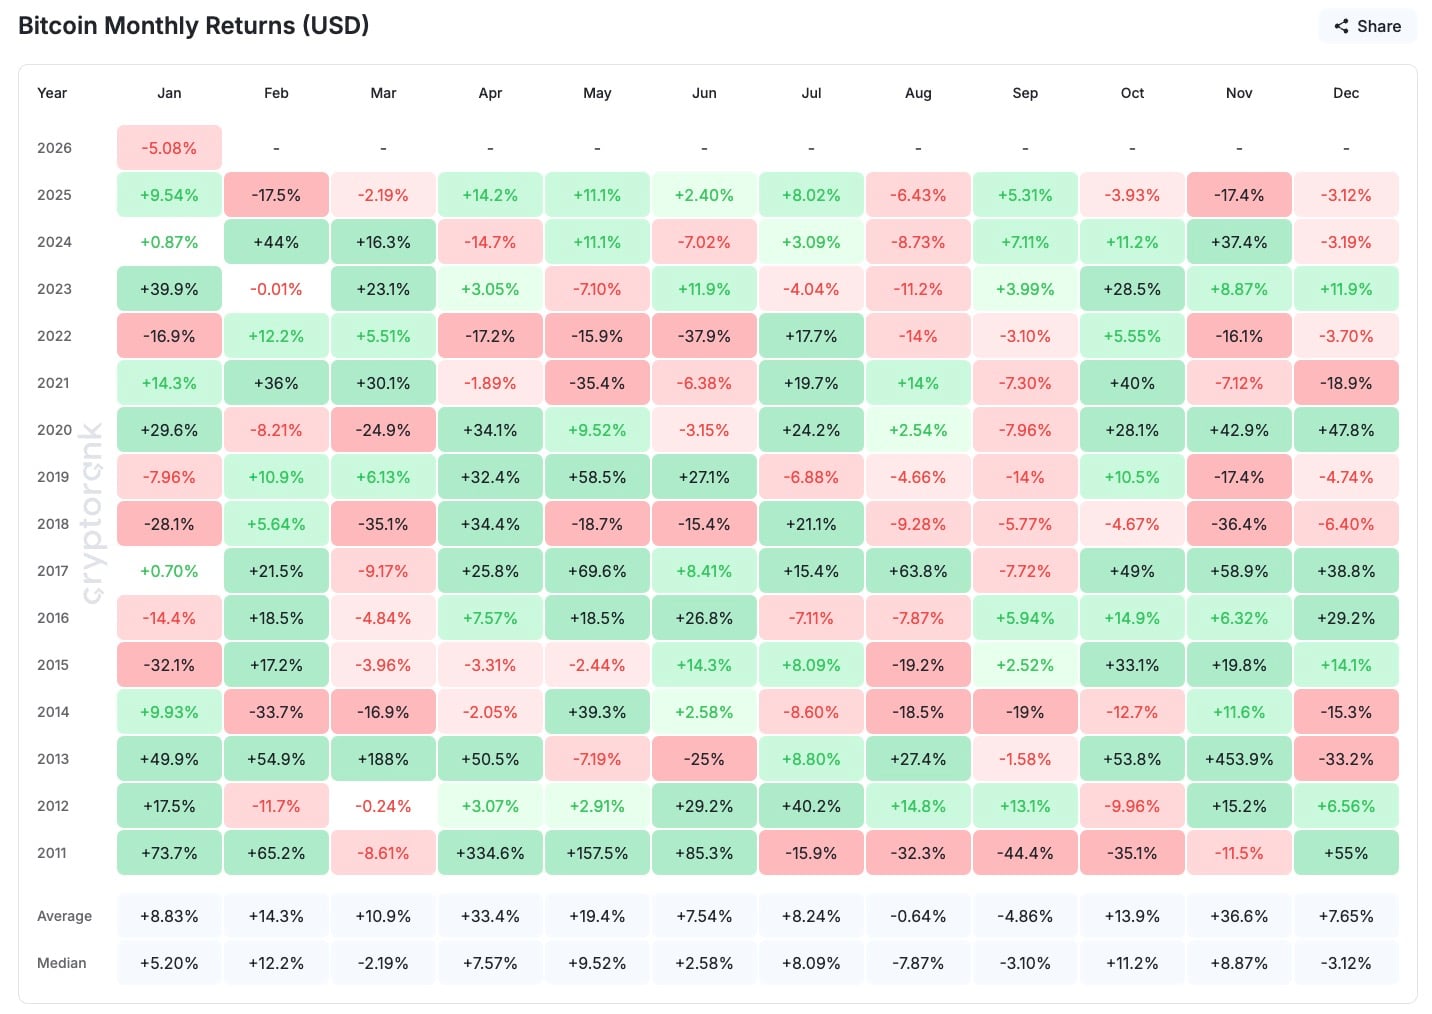
If you look at the last 13 years of Bitcoin's history, you will see that February has been a good month in nine of those years. The average gain is +14.3%, and even the more established median figure is +12.2%.
We are not just talking about a seasonal pattern here. Even in 2023's bear market rebound, February still saw +12.2% growth. In 2021, midbull phase? +36%. Back in 2014, right before the collapse? -33.7% — but that was the outlier.
Bitcoin price history proves that red January leads to green February
Bitcoin's worst Januarys often turn into green Februarys. In 2022, there was a -16.9% change in January, followed by a +12.2% in February. In 2020, it dropped 8.21%, but then it bounced back with a 21.5% rebound. The year 2015 was rough with a -32.1% loss, but it was followed by a +17.2% gain. Even in 2018, after the blowoff, BTC still added +5.64% in February.
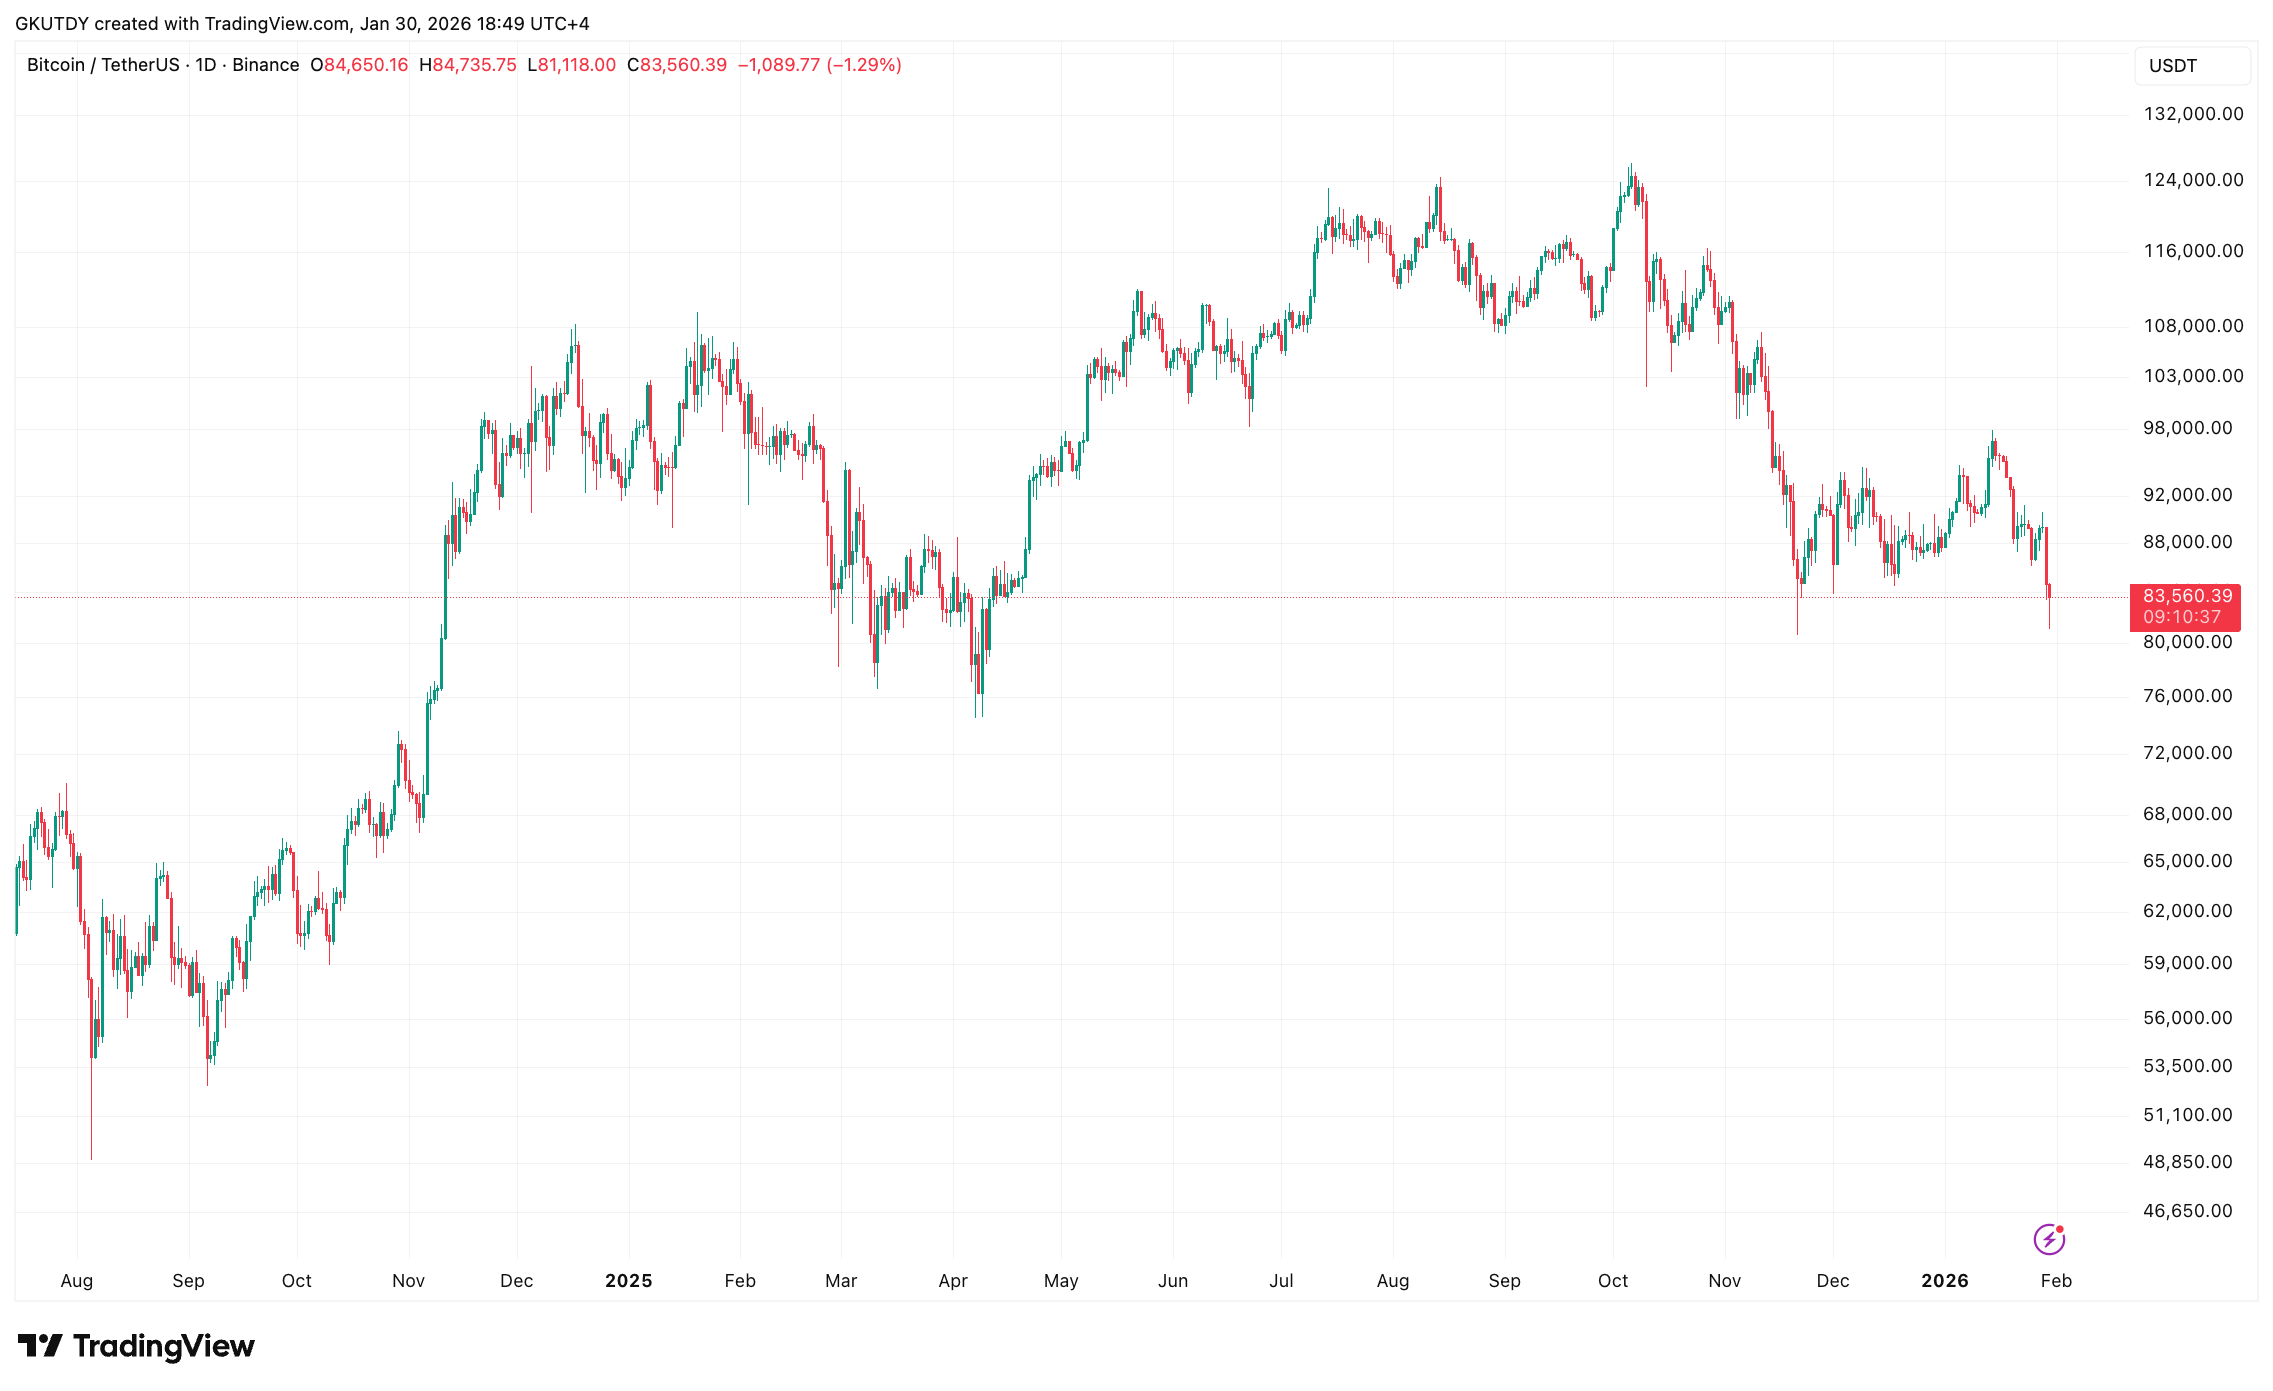
From one perspective, Bitcoin just dipped below $85,000 again, but from the other, it is still holding within the same $80,600-$107,000 range it has mostly been in since Q2, 2025.

The -2.12% daily drop we just saw is not just a one-time thing; it is a big deal, and it could totally change how things go in February. The ETF bleed is still going on, but the derivative pressure is easing up. If $80,600 holds, a bounce back into the $90,000s is not only possible but statistically likely.
The market moves on structure, not slogans. And February's slogan, over 13 years, is still looking good. Yes, the chart's pretty bad, but the historical precedent is not.
 Dan Burgin
 U.Today Editorial Team
 Vladislav Sopov