
Disclaimer: The opinions expressed by our writers are their own and do not represent the views of U.Today. The financial and market information provided on U.Today is intended for informational purposes only. U.Today is not liable for any financial losses incurred while trading cryptocurrencies. Conduct your own research by contacting financial experts before making any investment decisions. We believe that all content is accurate as of the date of publication, but certain offers mentioned may no longer be available.
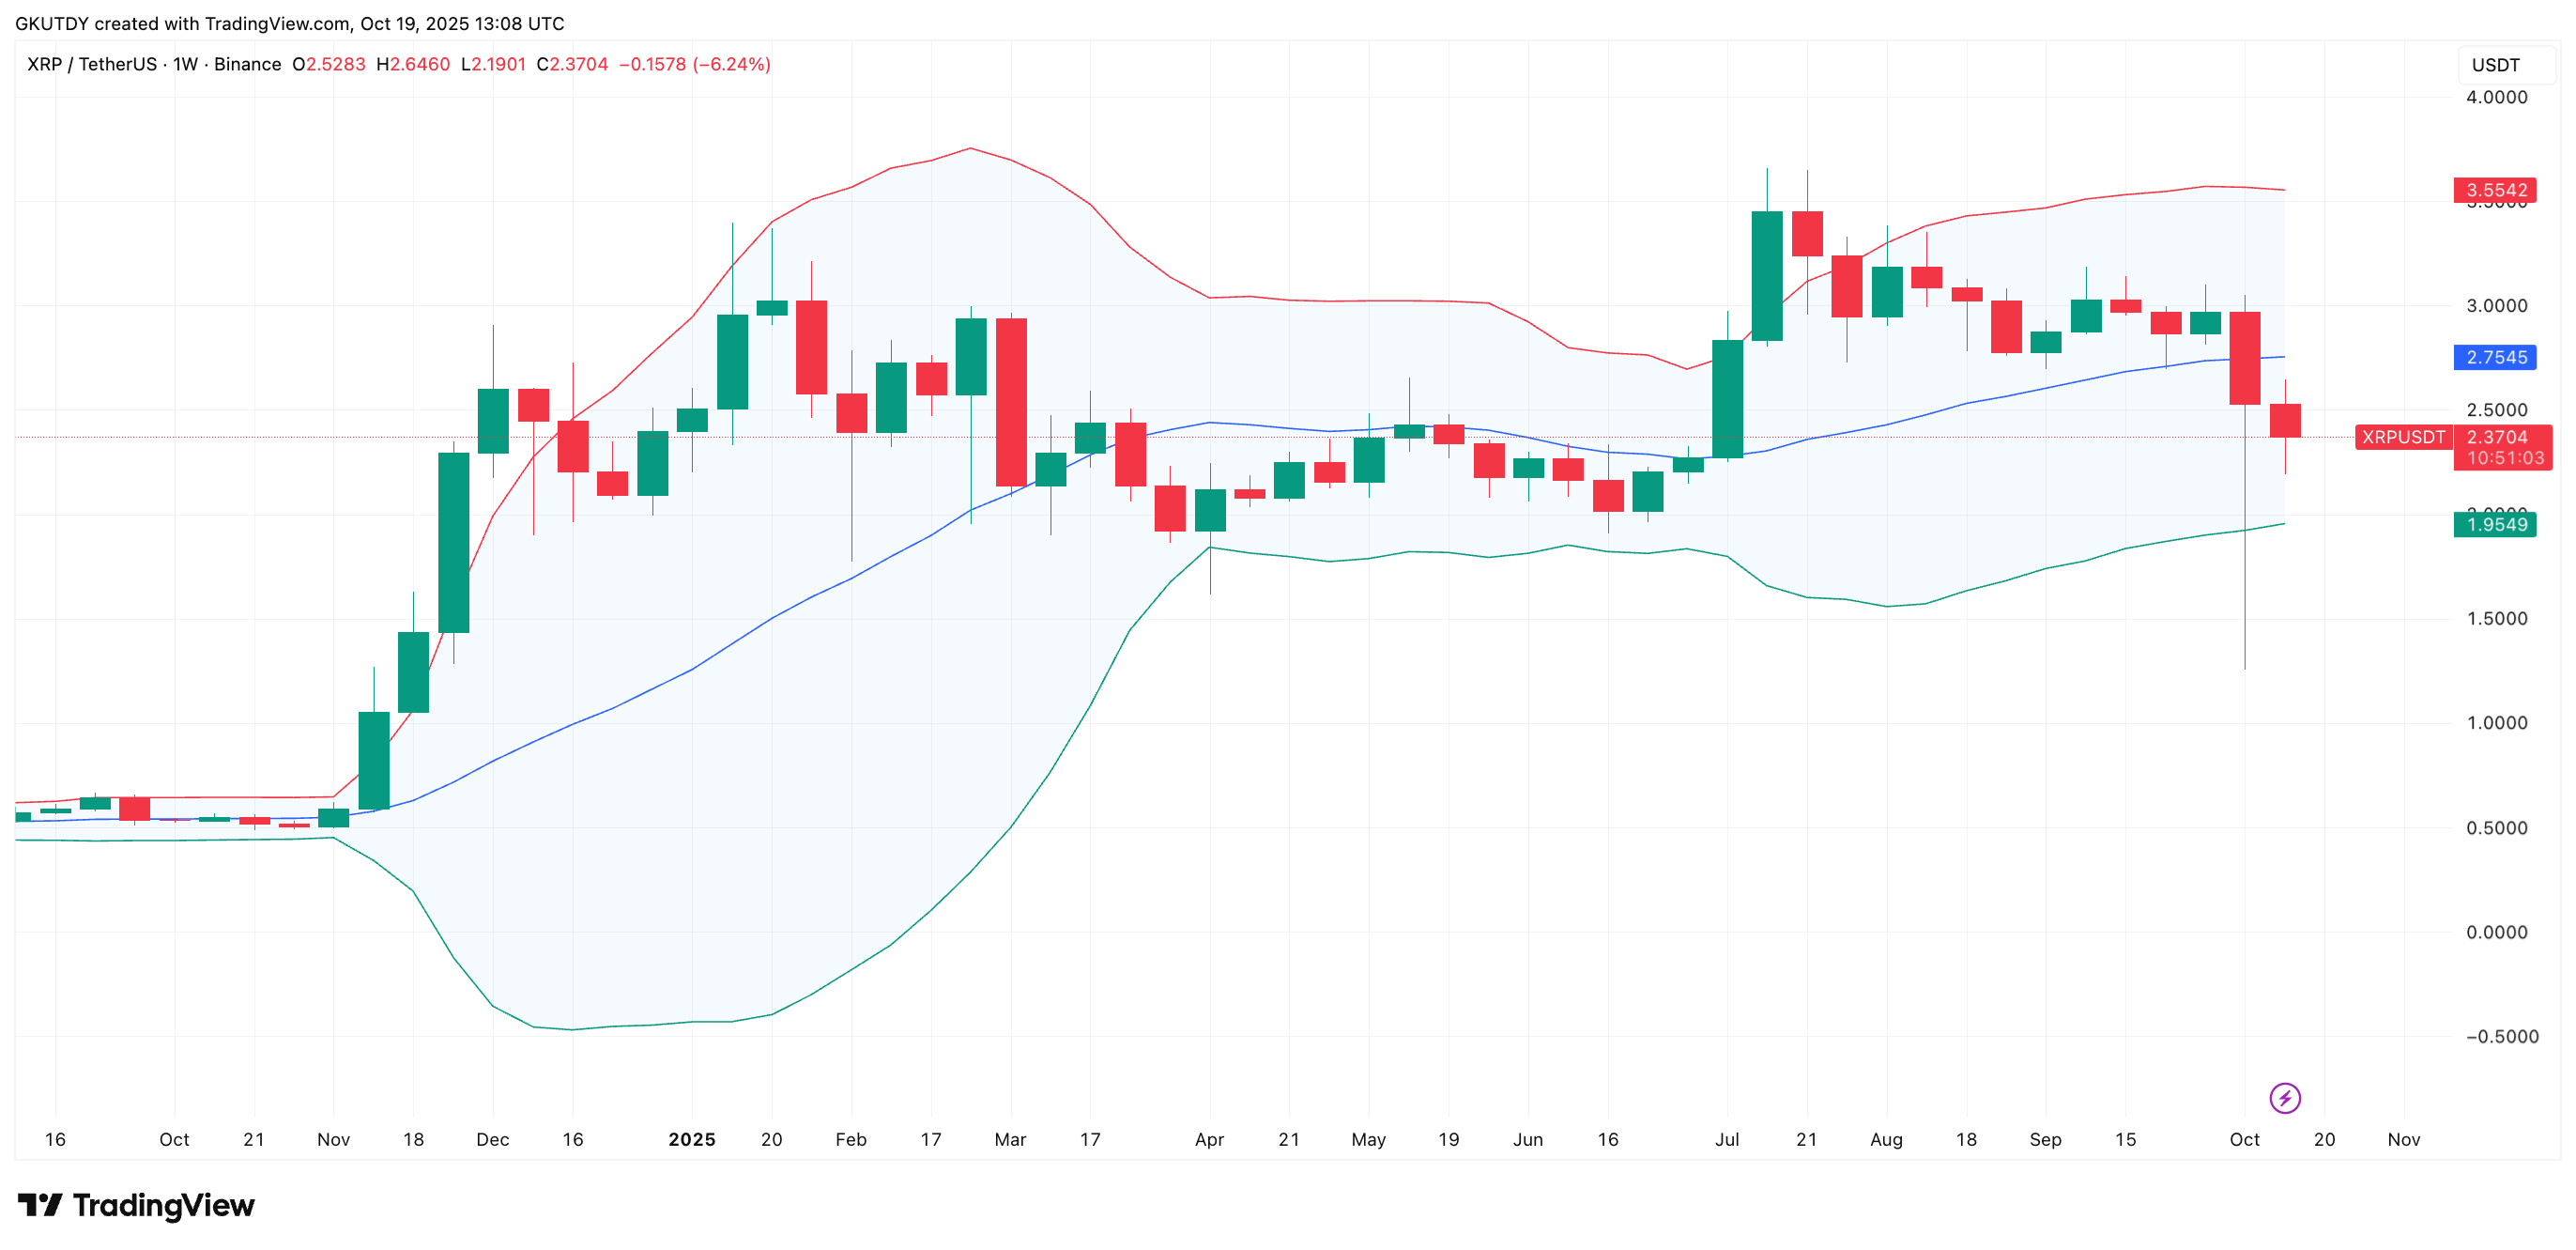
XRP is stuck in a spot traders already hate with quotes at $2.37 today after a fast trip to $2.19, and charts are showing the same problem — the price is breaking down through the middle line of the Bollinger Bands and now heading toward the bottom edge.
On a weekly time frame, that coveted threshold sits at $1.95, which means the indicator itself allows a dip below $2 without any sign of being oversold.
Daily candles are no better. XRP's price has been riding the lower band at $2.12 for days, while the middle line at $2.67 now feels out of reach. Every attempt to bounce fades before touching it.
Bollinger Bands on XRP price
For those not fluent in Bollinger Bands, it is a moving average with two volatility rails. When candles close above the middle band, it is strength. When they live at the bottom rail, it is a weakness. Right now XRP is at the bottom on both time frames, so the bias is not hard to interpret.
That’s why the $2 price point matters. It is not just a round number on the chart, it is where stop losses sit, and conviction has been hiding since July. Break it cleanly and the cascade risk is obvious — liquidations, exits, new shorts, sell pressure.
Not long ago, XRP was feeling at home at $3.58 at the upper band, now the same tool says $1.95 is fair game. Unless buyers take back the middle band soon, calling $2 a reliable floor may turn into nostalgia rather than legitimate due diligence.
 Dan Burgin
 U.Today Editorial Team