Disclaimer: The opinions expressed by our writers are their own and do not represent the views of U.Today. The financial and market information provided on U.Today is intended for informational purposes only. U.Today is not liable for any financial losses incurred while trading cryptocurrencies. Conduct your own research by contacting financial experts before making any investment decisions. We believe that all content is accurate as of the date of publication, but certain offers mentioned may no longer be available.
The crypto market is in a state of limbo right now, which is understandable considering the seasonality of fall — historically both bearish and bullish — and, adding to that, the macro uncertainty, especially in the U.S., to which cryptocurrencies are now strongly tied.
A possible government shutdown and $1.5 billion in FTX payments affect market sentiment, and at the center of this is XRP, a $180 billion asset with thousands of retail holders.
To answer the headline question, "What's with the XRP price right now?" setting aside all fundamental bias, let's take a look at the Bollinger Bands, one of the most popular and ultimate tools to estimate price over time.
Worst case scenario
On the daily chart, XRP is trading at $2.84, below the middle band, which is near $2.94. This indicates a bearish bias, as every attempt to rise above it has been rejected over the past two weeks. The lower boundary at $2.72 is the real marker to watch.
If the price stays under the midline, retesting the lower boundary is the natural course. Slipping through it could open the way back to the $2.20 zone that framed the market earlier this year.
Best case scenario
The weekly chart paints a different picture. XRP is still above its weekly midband of $2.73, meaning that longer-term holders have not lost control. The upper edge at $3.56 shows the potential if momentum returns.
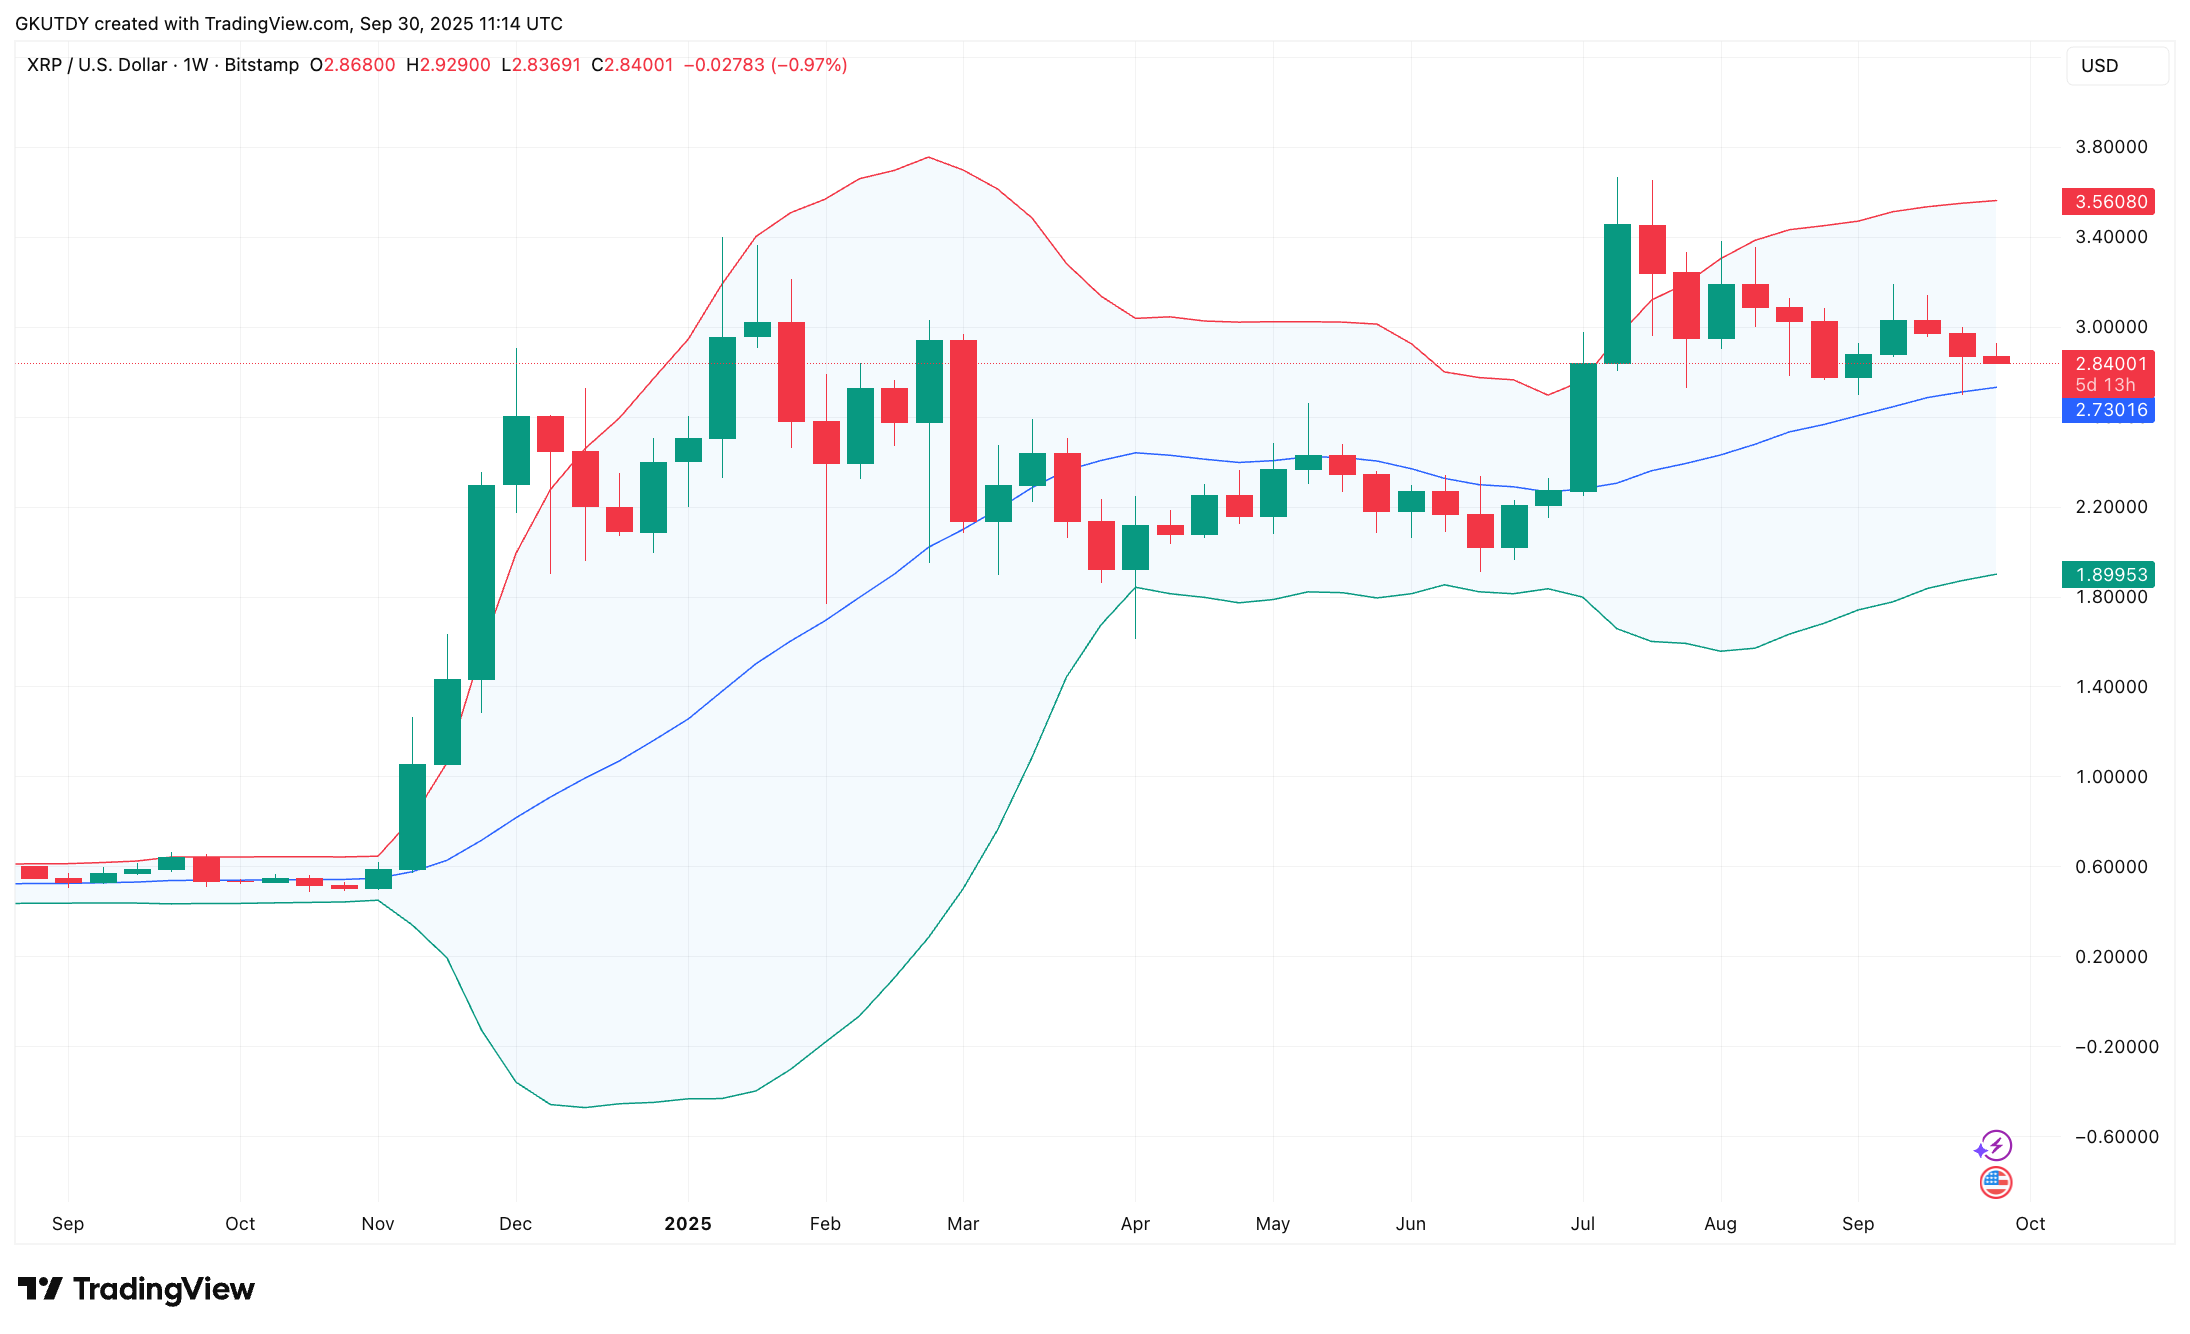
In previous cycles — December 2020, April 2021 and July 2022 — the pattern was the same. Once the weekly midband was defended, rallies to the upper band occurred within weeks.
However, when that level failed, as it did in May 2022, the price dropped sharply and took months to recover.
Bottom line
On the monthly scale, the setup is more neutral than threatening. The token has managed to stay well above the central line near $1.57, leaving room for the broader trend to remain intact.
In short, the daily chart is negative, the weekly chart is balanced and the monthly chart is positive.
 U.Today Editorial Team
 Dan Burgin