
Disclaimer: The opinions expressed by our writers are their own and do not represent the views of U.Today. The financial and market information provided on U.Today is intended for informational purposes only. U.Today is not liable for any financial losses incurred while trading cryptocurrencies. Conduct your own research by contacting financial experts before making any investment decisions. We believe that all content is accurate as of the date of publication, but certain offers mentioned may no longer be available.
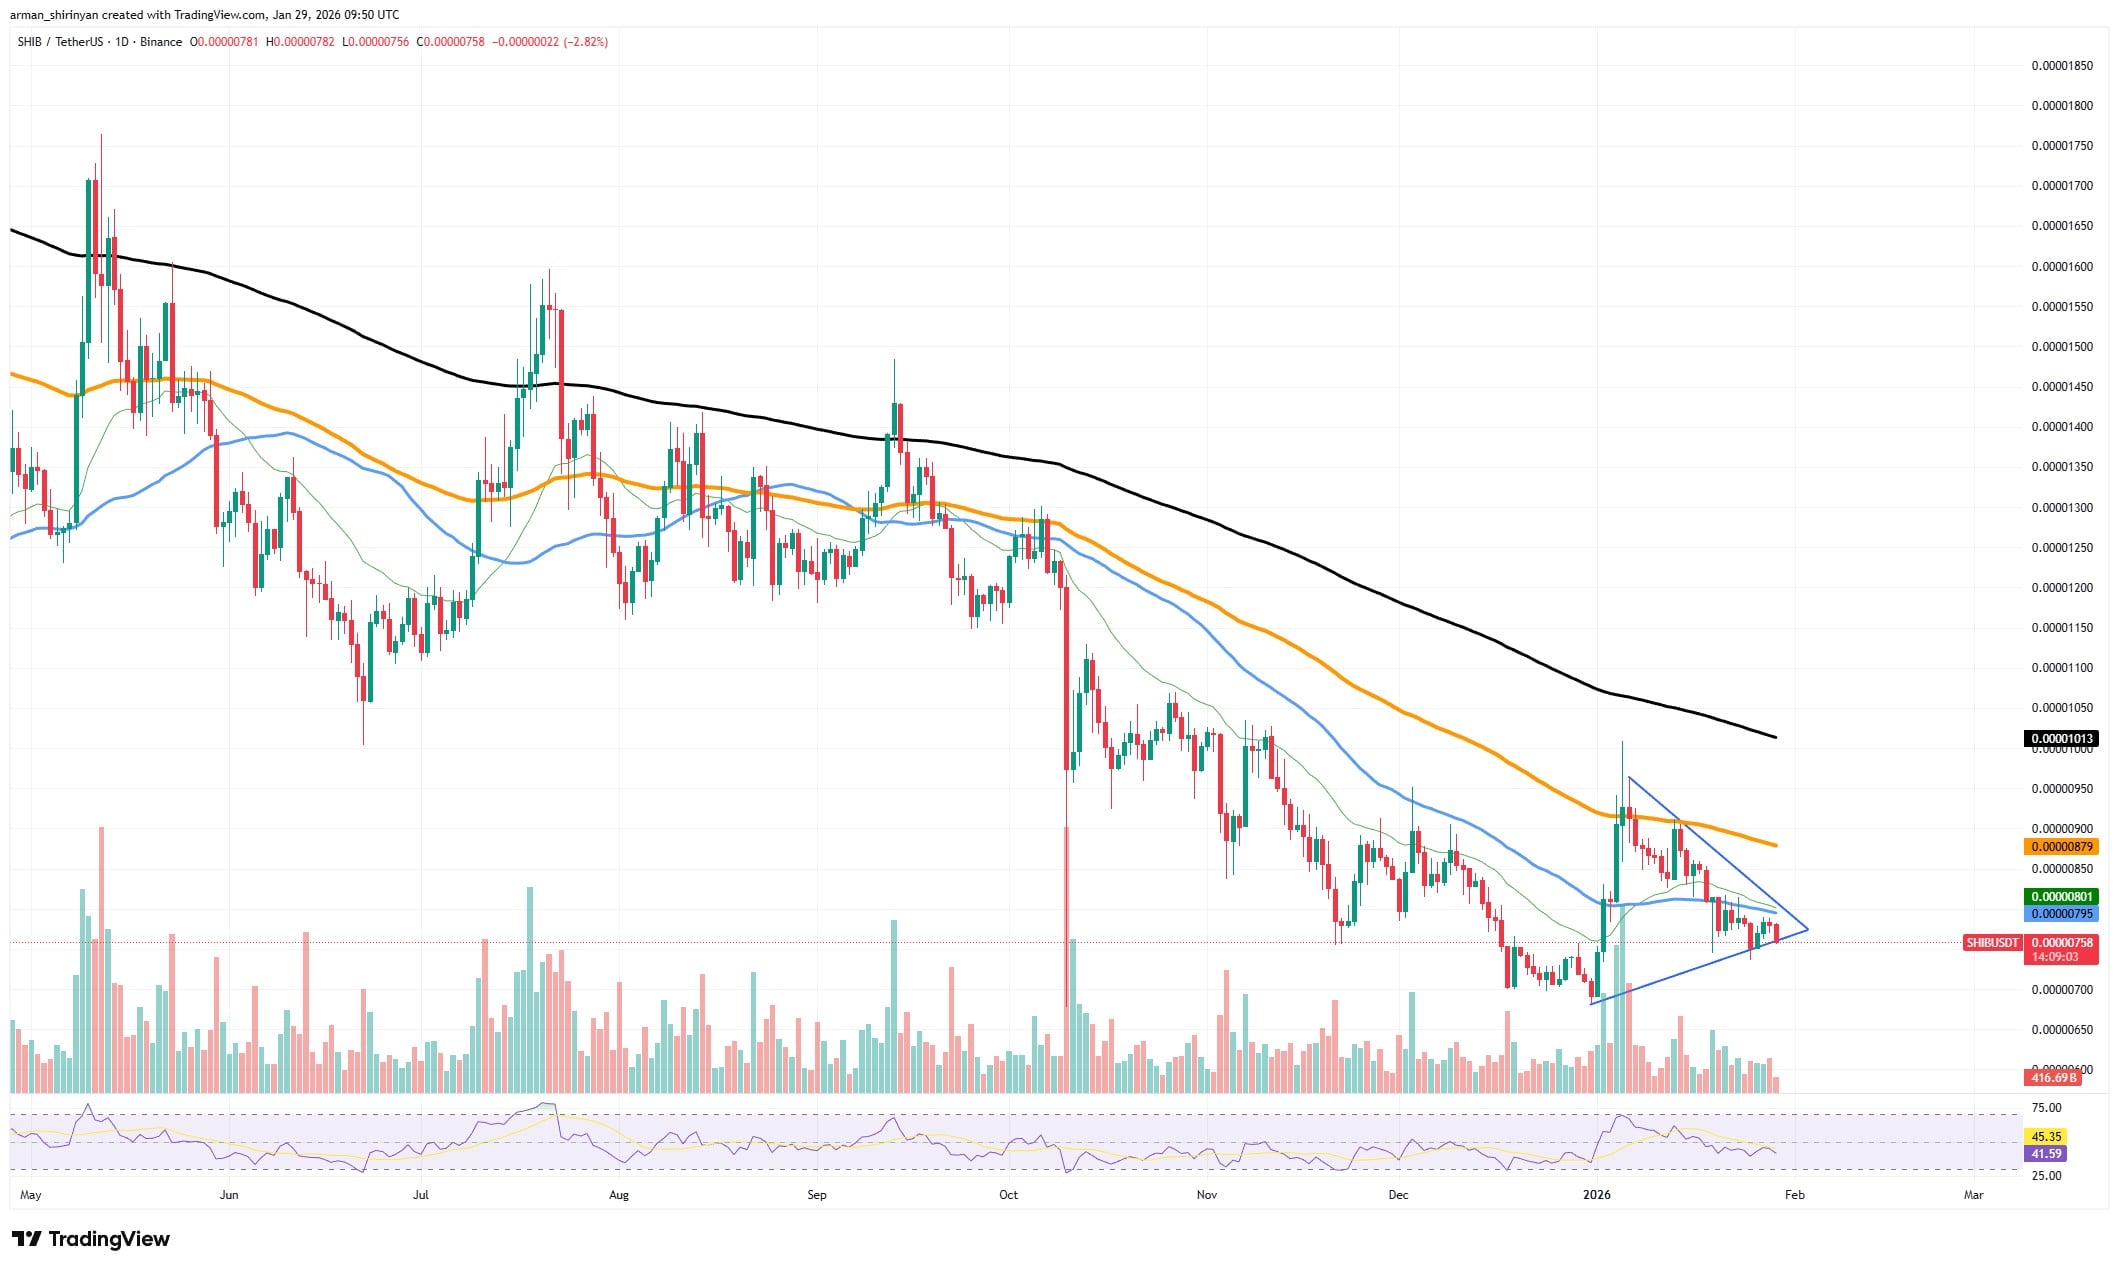
As Shiba Inu narrows into one of the tightest structures it has printed in months, the chart is approaching a decision point, and the price is presently trapped inside a symmetrical triangle, a traditional sign of a market storing energy before a directional move due to declining volatility, converging trendlines and contracting candle bodies.
Shiba Inu moving sideways
This is not random sideways action, because the triangle is forming following a long downward trend, which alters its interpretation and shifts expectations away from simple continuation selling. Instead of continuation selling, the structure suggests seller fatigue, where every push lower is weaker, buyers are getting involved earlier and the lows are rising, suggesting a slight shift even though the overhead pressure is still present.
The triangle's apex is very close, and when the price hits this compression point, liquidity drives expansion and prevents indecision, forcing participation from both sides of the market. Breakouts from structures this tight have traditionally expanded violently rather than drifting, because both sides are overleveraged and underhedged, creating conditions where hesitation cannot persist.
Where things get interesting
The important level to keep an eye on is the upper triangle boundary near the short-term moving averages, and after a breakout above the 50 EMA, SHIB would immediately enter the resistance zone, which is the first real battlefield. If buyers clear that area with volume, the next magnet will be near the 100 EMA, which is consistent with the previous breakdown structure, and that zone could result in an expansion move of 8-12% if momentum increases.

On the down side, if there was no breakup, the bullish compression thesis would be disproved, and the recent local lows where there is no liquidity protection would likely be retested in a triangle breakdown, reversing the current optimistic bias. However, the structure currently favors upside because the market has stopped making aggressive lower lows, and RSI supports the narrative of compression.
This is not a trend but rather a trigger zone, where waiting for confirmation is imperative, since entering inside the triangle is known as gambling and entering following a breakout is known as positioning.
The conclusion is simple: SHIB is not moving at this time, but it will shortly, and the chart is twisted, with the decision made at the tip of the triangle, where the subsequent expansion will dictate the short-term movement.
 Dan Burgin
 U.Today Editorial Team