Disclaimer: The opinions expressed by our writers are their own and do not represent the views of U.Today. The financial and market information provided on U.Today is intended for informational purposes only. U.Today is not liable for any financial losses incurred while trading cryptocurrencies. Conduct your own research by contacting financial experts before making any investment decisions. We believe that all content is accurate as of the date of publication, but certain offers mentioned may no longer be available.
Usually, the market tries to keep it calm on Sundays, but early 2026 was not going to wait for Monday to start throwing numbers around. One big SHIB address got fed directly from Coinbase Prime for 1.44 trillion coins, XRP derivatives market managed to liquidate almost only one side in the last hour, and Bitcoin is sitting in that familiar zone where a single weekly push can make $100,000 stop sounding like a dream and start sounding like a done deal.
TL;DR
- A whopping 1.44 trillion SHIB was transferred from Coinbase Prime to a single new Shiba Inu whale address.
- XRP experienced an 18,913% liquidation imbalance, with shorts facing the brunt of the impact.
- Bitcoin maintains its position at $100,000 as the January headline level.
Unknown Shiba Inu whale empties Coinbase for 1.44 trillion SHIB
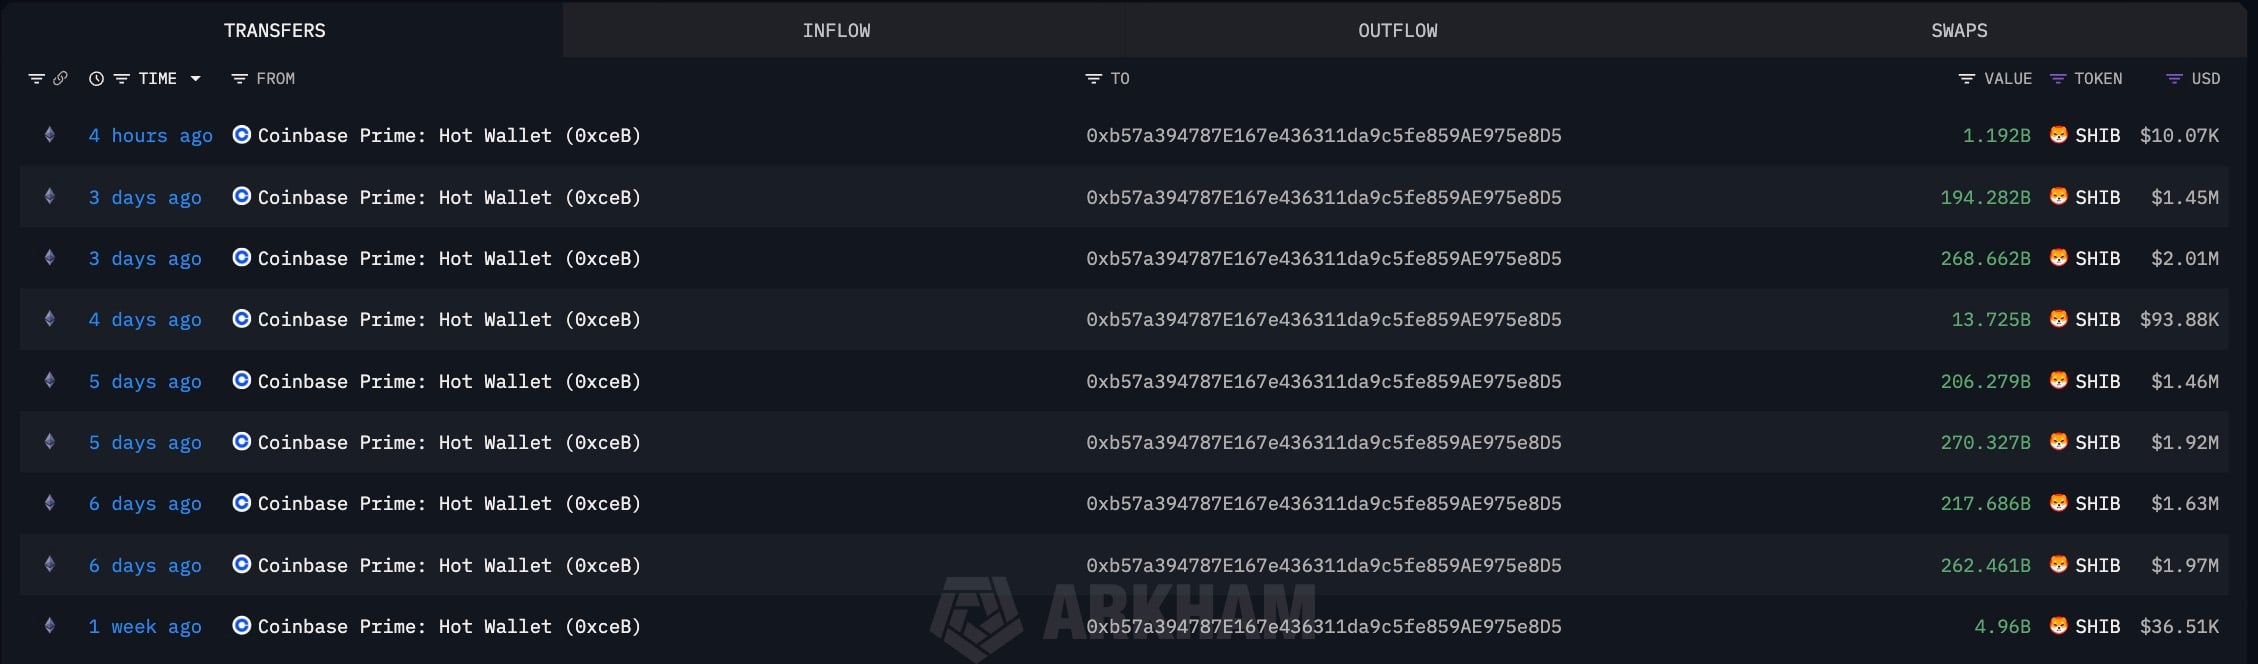
SHIB printed a clean exchange-drain setup on Sunday afternoon, not the usual vague wallet shuffle. A Coinbase Prime hot wallet sent nine transfers in a row to the same address, 0xb57, for a total of 1.439574 trillion SHIB in one visible stream, as per Arkham.
Now this address shows a balance of 1.44 trillion SHIB, which is about $12.58 million, and SHIB was trading around $0.0000087 when the move happened.
When tokens exit an exchange, the market instantly prices the "less coins on venues" angle, regardless of the reason. It does not guarantee long-term lockup. Custody reshuffles, cold storage or staging wallets are still considered short-term supply.
The price reacted like it always does when supply and demand are out of balance. On the daily SHIB/USDT chart, Shiba Inu opened near $0.00000809, went up to $0.00000880, dropped to $0.00000807 and is around $0.00000872 now, which is a 7.79% daily gain.
The structure is easy to read. Right now, the market is testing the $0.00000900 line. And if you look at the numbers above that, you will see $0.00001102 and $0.00001203, which are the next upside checkpoints. If the price dips below $0.00000699, it could invalidate the bounce.
The near-term outlook is binary. If it is above $0.00000900 per SHIB, it will keep going up. If you lose it, the move just gets filed away as another custody change, with no lasting impact. The next sessions will decide which version sticks for the Shiba Inu coin.

XRP stuns bears with 18,913% liquidation imbalance
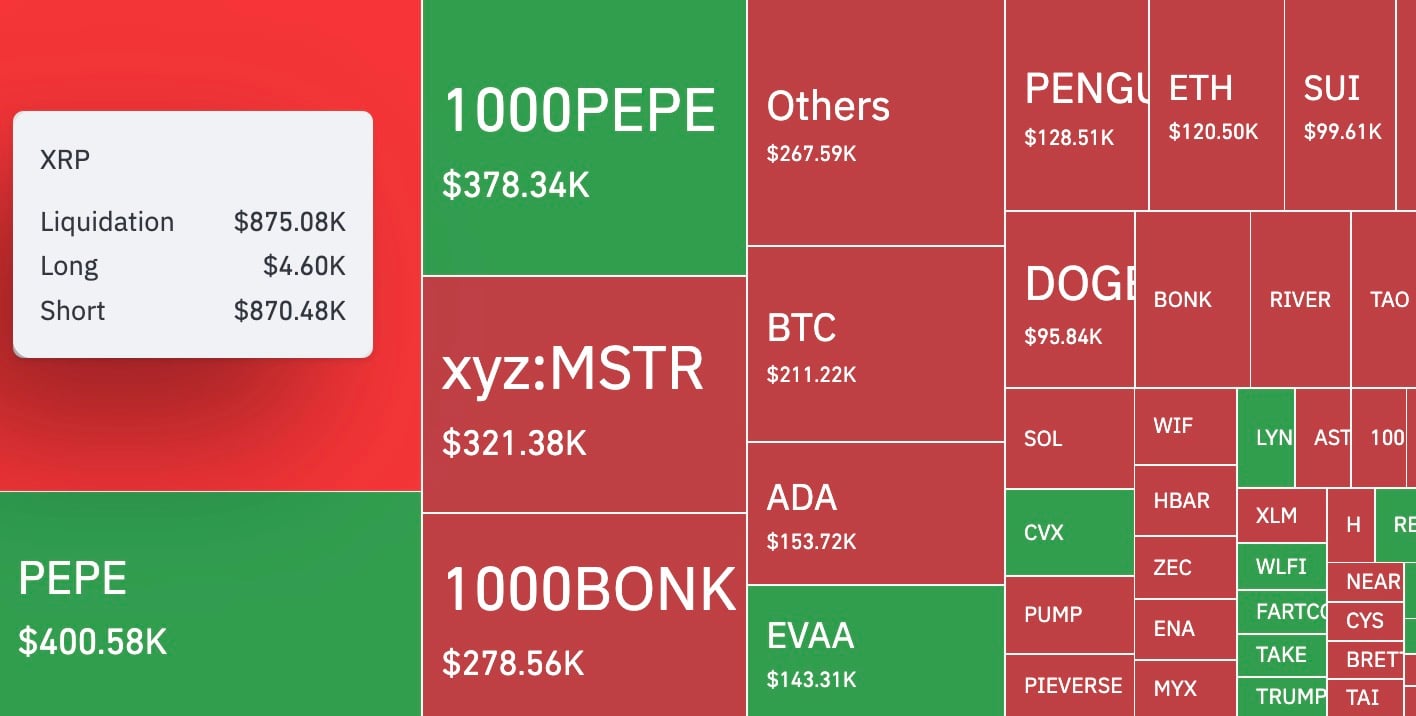
The XRP part is all about derivatives, but the numbers are so uneven that you don't need fancy language to sell it. The liquidation heat map by CoinGlass shows XRP liquidations at $875,080, with $4,600 in long liquidations and $870,480 in short liquidations. That split is the whole story because it means the last hour mostly wiped out people leaning short, which is how you get a headline like "18,913% liquidation imbalance" without needing any extra context.
What makes it interesting is that the XRP price itself is not behaving like a coin that just went vertical. On the XRP/USDT chart, the latest print is $2.0863 with the hourly low at 2.0833, and it is basically flat. The session also shows that XRP spent the day grinding from the low $2.03 area into the $2.09 zone and then moving sideways near the highs.
The imbalance here indicates problems. Shorts getting destroyed and the price looking controlled suggest a two-way scenario: a crowded short being forced out on a small push or liquidations happening in one place while spot stays calm. Either way, wrong positioning continues.
If XRP stays at $2.08 and does not bounce back, the next liquidation print can go from "shorts got hit" to "late longs got baited," which is usually when things on the price chart get chaotic.
For now, it seems like the market read that bears tried to fade the move and paid for it, while spot traders watched it happen without needing a fireworks candle.
Is $100,000 for Bitcoin in January inevitable?
Bitcoin is the piece that makes this whole Sunday pack into a bigger story, because the weekly chart is already doing the job for the bull case. The BTC/USDT weekly candle by TradingView printed at $87,952.71 at the open, hitting a high of $91,810.00 — up 3.90% for the week.
If you look at the Bollinger Bands on that same weekly view, you will see that the midline is at $103,522.98, the lower band is at $79,800.54, and the upper band is up at $127,245.41.
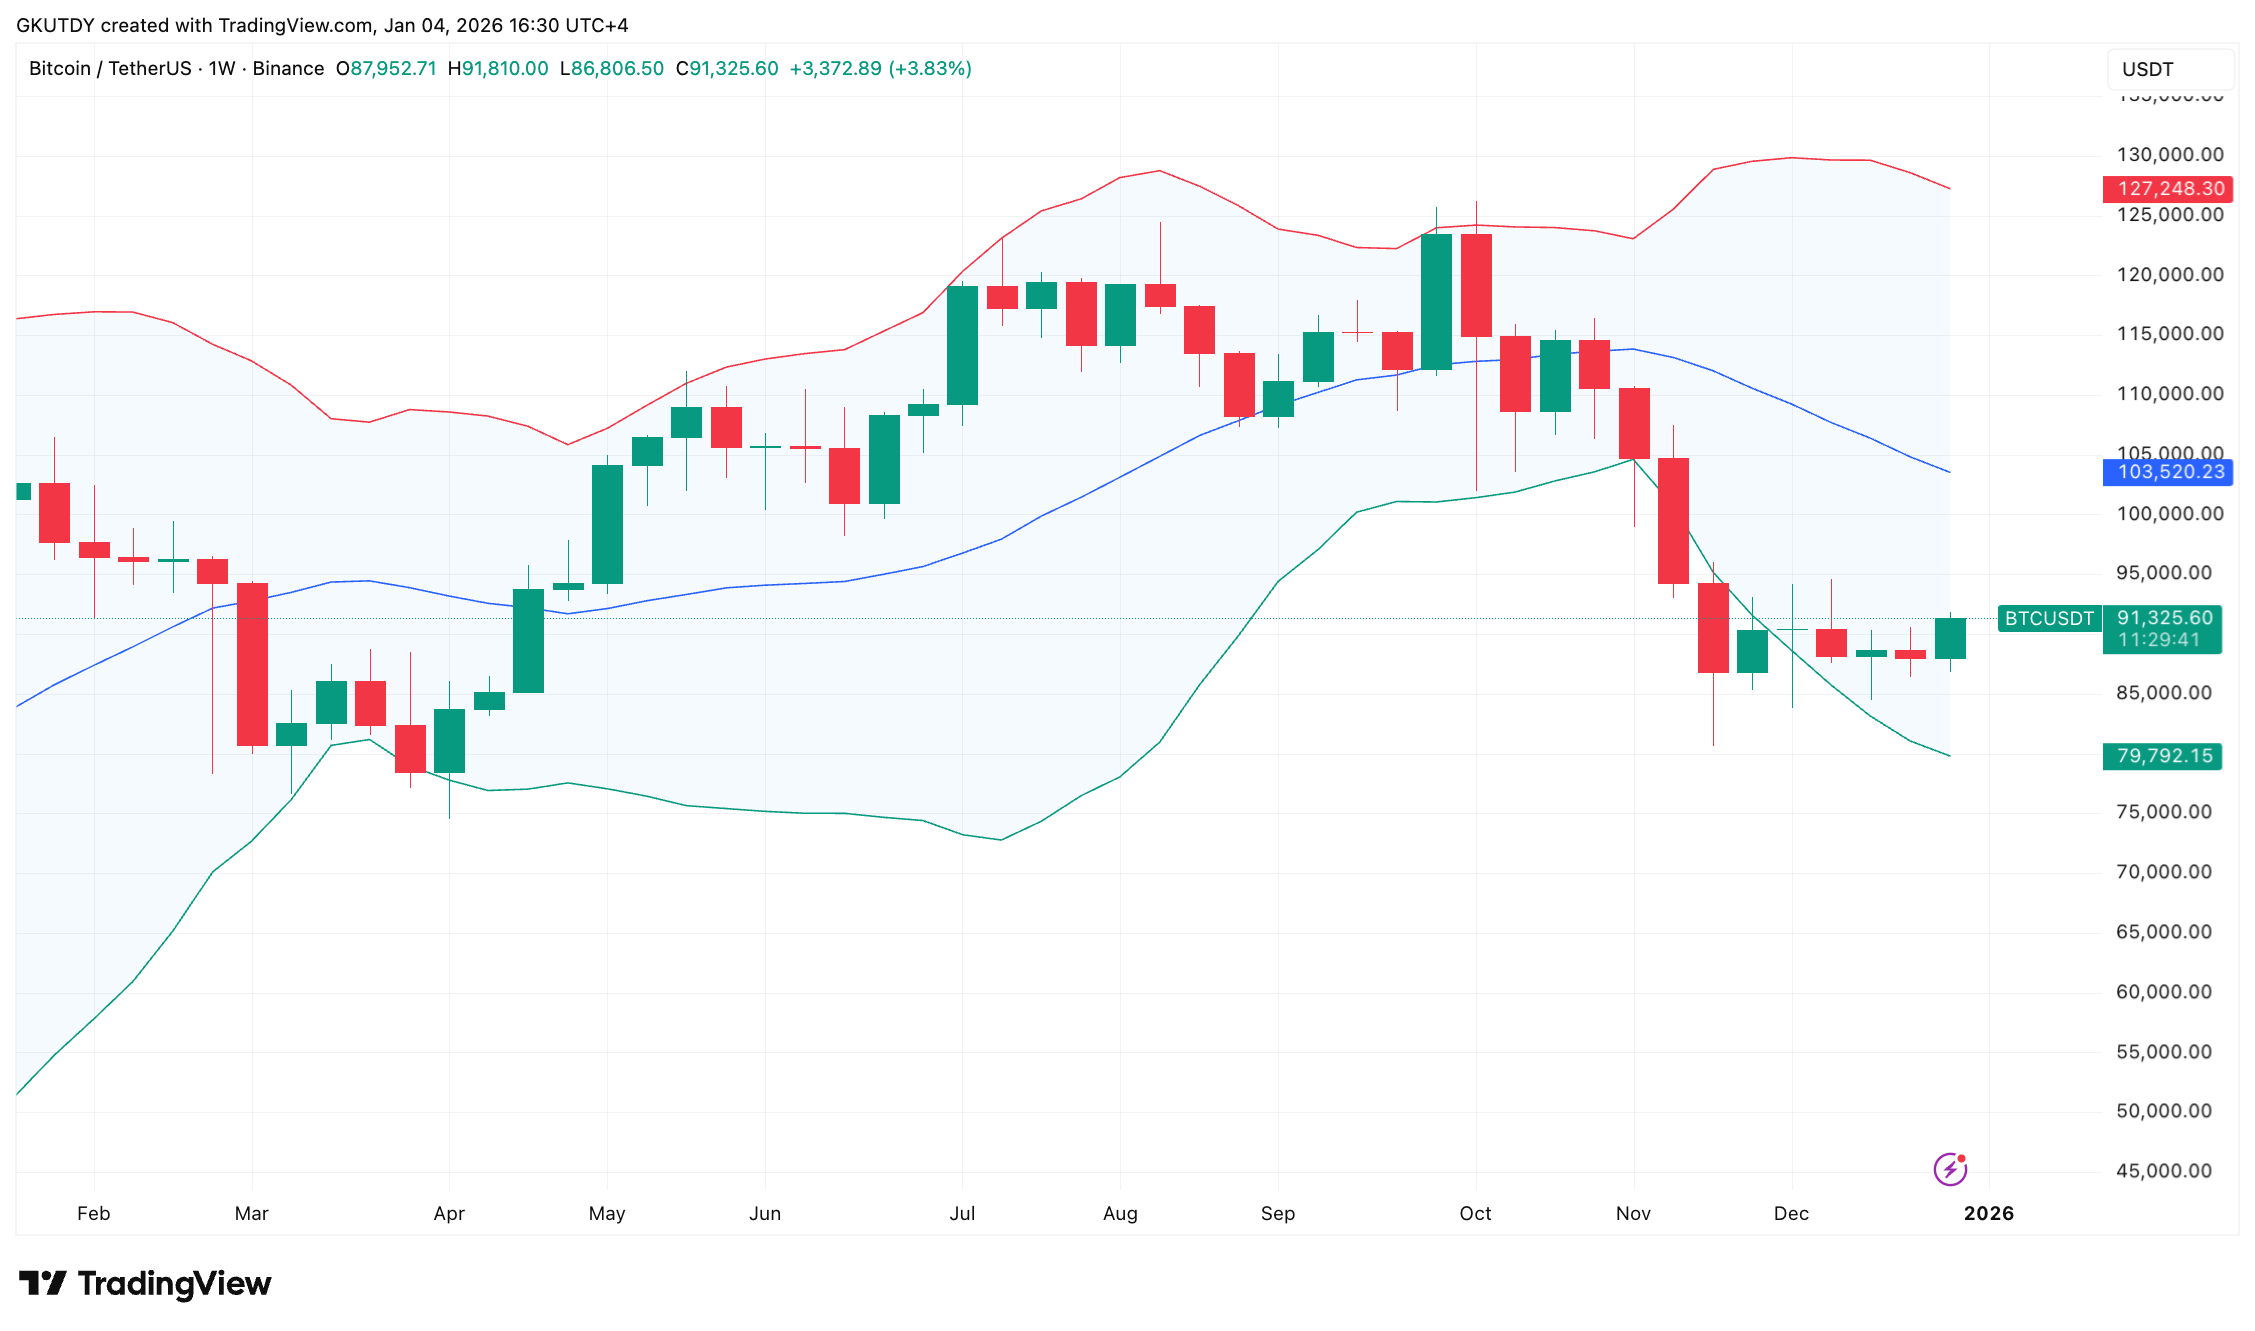
Why is the $100,000 number popping up? It is right there in the sweet spot between the current price and the mid-band. And let's face it, markets love a good chat about that mid-band — it is like the obvious "next test" line in trending phases.
Could we expect a payment of $100,000 in January? That word is doing too much, but the setup is obvious. If Bitcoin's price can keep hitting new weekly highs around the $90,000s and start pushing toward that $103,522.98 midline, hitting $100,000 might make sense. If Bitcoin loses steam and dips toward the lower end of the range, the January 2026 $100,000 prediction could be looking a lot more like a late 2025 scenario.
Crypto market outlook
The first Sunday of 2026 delivered a very specific combo.
If follow-up SHIB transfers keep coming from exchange-tagged sources, that part turns from headline into trend, and if XRP keeps sitting near the highs after wiping shorts, the next wave of leverage will decide whether the squeeze is done or just starting.
- Shiba Inu (SHIB): price last shown around $0.00000872 after a 7.79% daily move, with $0.000009 as the line to reclaim, then $0.00001102 and $0.00001203 above and $0.00000699 as the level that defines failure.
- XRP: last shown around $2.0863, with the day swinging from the low $2.03 area into the $2.09 zone.
- Bitcoin (BTC): weekly close shown at $91,380.58, with $103,522.98 as the Bollinger midline target, $79,800.54 as the lower band reference and $127,245.41 as the upper band cap.

 Dan Burgin
 U.Today Editorial Team