At first glance, it might seem that Ethereum is simply following Bitcoin’s lead and moves up and down during the recent days. However, traders are sure it’s preparing a surprise for us.
Will it be positive or not? Discover possible scenarios in Ethereum price predictions from TradingView users.
Bullish signs are clear

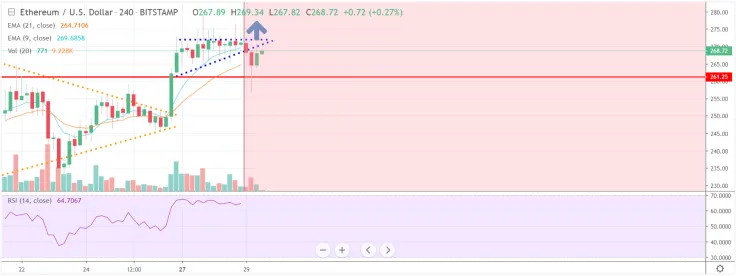
According to J05B, there’s a lot of bullish action on the crypto market. BTC did and amazing rally again and ETH has not really followed yet. There is definitely some great opportunity for ETH to rally now.
Things are lining up. Red line could be used as a stop. Breaking $280 would clear the way for a target of $350. RR seems still good at this point but if you are not already waiting for the breakout. If BTC will maintain stable for the coming days ETH can show some action.
Bull Flag Breakout

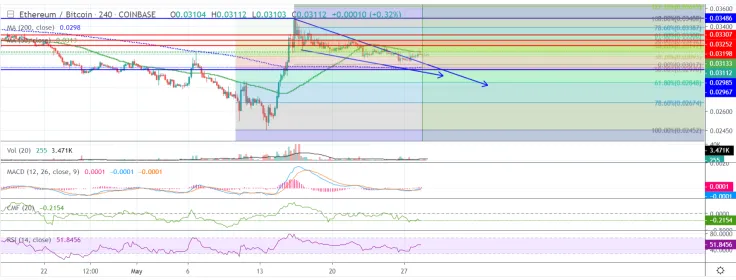
Looks like the beginning of a bull flag breakout on ETH/BTC. If the pullback is limited at the 38.2 fib the upside is large.
There is resistance at many levels, indicated with horizontal red lines, but the daily chart looks good. Probably, ETH will get back to 0.034 level in the upcoming days.
ETH/BTC – Interesting position

Ethereum is well known as the altcoin that represents the entire altcoin market. Once we see upside momentum on ETH/BTC pair, usually it is followed by the upside momentum of other alts.
In 2017 it was followed by entire altcoin market making an astonishing bull run but recently bullishness in this pair caused only majors to move.
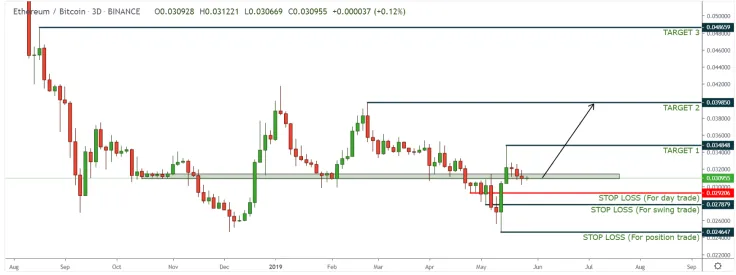
It is hard to say what it will cause this time but after breaking below support, it reclaimed it again which is a pretty bullish sign. If you are looking to long/buy XRP/BTC, there are 3 areas you can use for invalidation.
For hodlers, it is the third area because that's monthly support and if we broke below, we could see easily 20-30% more to the downside.
For swing trading, the area I would consider using as the stop loss is an important daily level that was first to form bigger rejection after breaking the major support level.
The stop loss for day trade is the first level acted as support after breaking the major support.
ETH on the way to $350 and beyond

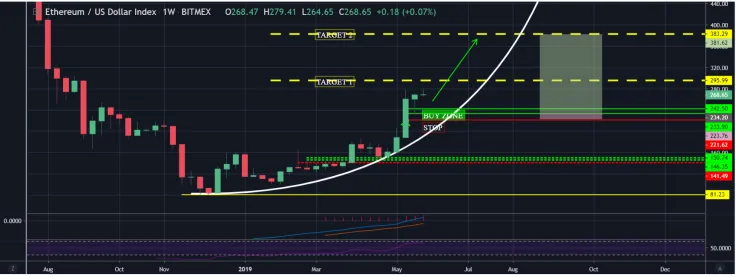
Ethereum seems to be in a sideways forever pattern but let’s not forget that Ethereum has outperformed Bitcoin with a massive 240% profit compared to BTC 175% since our Parabolic rise started in December 2018.
Ethereum has one more push here and then another correction and after that, we should again have a strong push higher to $350 and beyond. If we also have a close look at the ETH/BTC pair we can see that ETH is currently holding strong in comparison.
Final words
What to expect from Ethereum price? It depends on the ability to overcome resistance levels. We have strong support at levels 188$ and 167$. If ETH manages to hit the $280 threshold, it might pump to $350.
If the price goes on correction, we will stop at these levels. As for the ETH/BTC market, the chances of the bullish run are evident, but a bit more volume won’t hurt, of course.
Ethereum price charts are taken from TradingView
 Vladislav Sopov
 Dan Burgin