
Disclaimer: The opinions expressed by our writers are their own and do not represent the views of U.Today. The financial and market information provided on U.Today is intended for informational purposes only. U.Today is not liable for any financial losses incurred while trading cryptocurrencies. Conduct your own research by contacting financial experts before making any investment decisions. We believe that all content is accurate as of the date of publication, but certain offers mentioned may no longer be available.
Once more, XRP is displaying symptoms of strain as it is unable to maintain momentum above significant resistance levels and runs the risk of further declining into a bearish pattern. XRP is currently trading close to $2.48 and is having trouble holding support above the 200-day moving average. It is also getting rejected frequently from the $2.75-$2.90 range.
Every recovery attempt over the last month has been essentially capped by this range, setting a barrier that is challenging to overcome in the absence of fresh buying interest. The daily chart shows a sequence of lower highs and lower lows, which is a classic descending pattern that indicates ongoing bearish pressure. Around 44, the RSI remains muted, suggesting that there are no significant inflows and that momentum is weak.
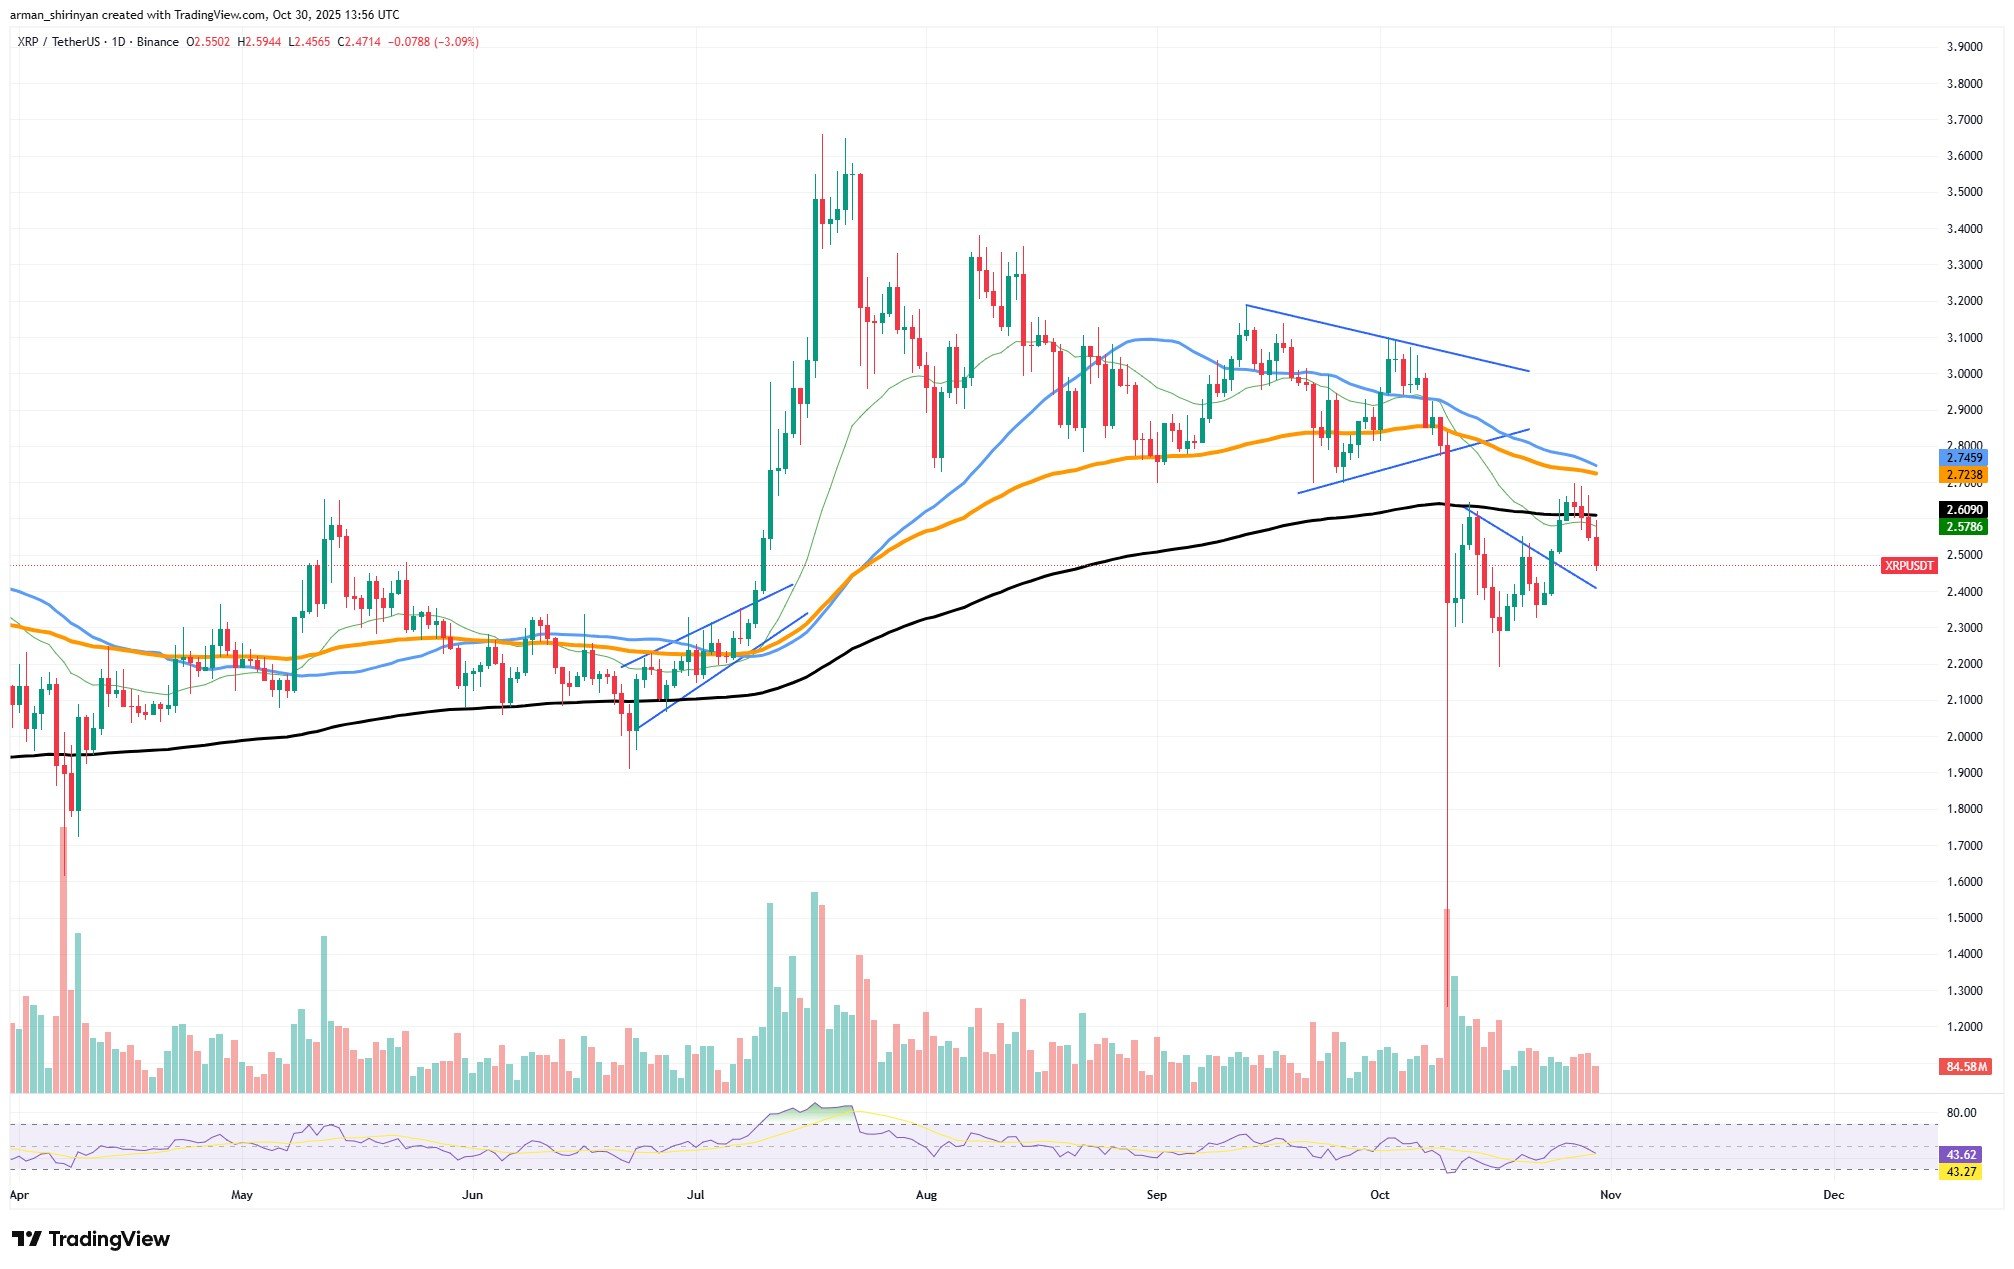
In the meantime, trading volume has decreased, suggesting that both bulls and bears are holding off on making a commitment until market conditions have changed more decisively. XRP must remain above $2.40, a crucial short-term support level that is in close proximity to its trendline base, in order to prevent a major breakdown.
An accelerated decline toward the $2.10-$2.20 range could be triggered by a breach below this level, thereby validating a deeper bearish continuation. A break above $2.75, on the other hand, might rekindle bullish optimism and drive XRP back toward the $3.00-$3.20 resistance zone.
XRP still has the potential to recover in the long run, despite the cautious attitude. XRP Ledger’s increasing burn activity and the network’s stable fundamentals could eventually produce a supply-side tailwind. Short-term technical analysis, however, points more toward a bearish correction than an instant recovery.
Shiba Inu close to pivoting
Shiba Inu is on the verge of a pivotal moment as its price approaches the lower limit of a significant short-term support level. The meme coin is testing the upward trendline that has been in place since early October and is currently trading at about $0.0000098, down about 3% for the day. The course of events over the next 48 hours may determine whether SHIB recovers temporarily or enters another extended decline.
There is an obvious tug-of-war between bulls and bears based on the technical setup. The 200-day moving average, which caps the descending resistance channel that has been in place for months, continues to exert pressure on SHIB. However, a small rising support line that has just appeared indicates that buyers are still trying to prevent the token from losing ground.

SHIB could easily drop toward $0.0000092 or even $0.0000088 if this support fails, which could result in another zero being added to its price. However, a short-term squeeze might occur if buyers are able to keep support close to current levels. The RSI is currently hovering around 39, an oversold area where prior rallies have frequently begun. When coupled with a steadily declining selling volume, this suggests that bears may be reaching their limit.
As the price compresses between convergent support and resistance lines over the course of the next two days, the pivotal moment is probably imminent. A successful recovery above $0.0000105 might lead to a relief rally toward $0.0000115, but any bullish setup would be nullified if it broke below $0.0000095.
Ethereum loses it again
In a dramatic reversal that has rekindled market pessimism, Ethereum has once again dropped below the crucial $4,000 mark. ETH is currently trading close to $3,820, down more than 2% over the past day as selling pressure increases and trader confidence declines.
A troubling technical picture can be seen on the daily chart. With the 50-day and 100-day averages currently convergent in a manner suggesting a possible crossover —a sign frequently linked to midterm bearish momentum — Ethereum’s price has failed to maintain above important moving averages. The final significant support line halting a more significant correction is the 200-day moving average, which is currently trading close to $3,600.

Ethereum’s failure to build on its prior recovery attempts is especially concerning. It appears that buyers are losing control and larger players are taking profits or derisking ahead of potential wider market volatility because every bounce above $4,200 has been immediately rejected. The RSI, which is centered on 41, shows that ETH is getting close to oversold conditions but has more room to drop before seeing a significant recovery.
The 200-day moving average may provide short-term stability at $3,600, the next logical support zone if Ethereum is unable to establish itself above $3,800. Nevertheless, a collapse below that mark might pave the way to a more severe decline toward $3,400-$3,300, which might wipe out weeks of gains.
Ethereum’s momentum is still strongly leaning downward for the time being. ETH may keep declining unless buying volume increases or Bitcoin levels off. This could change the mood in the short term and postpone any aspirations to break through the $4,200 resistance level anytime soon. Whether this slide develops into a full-scale correction will be determined by the market’s actions over the next few sessions.
 Dan Burgin
 U.Today Editorial Team