
Disclaimer: The opinions expressed by our writers are their own and do not represent the views of U.Today. The financial and market information provided on U.Today is intended for informational purposes only. U.Today is not liable for any financial losses incurred while trading cryptocurrencies. Conduct your own research by contacting financial experts before making any investment decisions. We believe that all content is accurate as of the date of publication, but certain offers mentioned may no longer be available.
Bitcoin is rapidly approaching six-figure territory once again, but as crypto bulls rejoice over this comeback, some technical indicators are sending a not-so-subtle warning: this achievement might not be as positive as it seems on the TradingView chart.
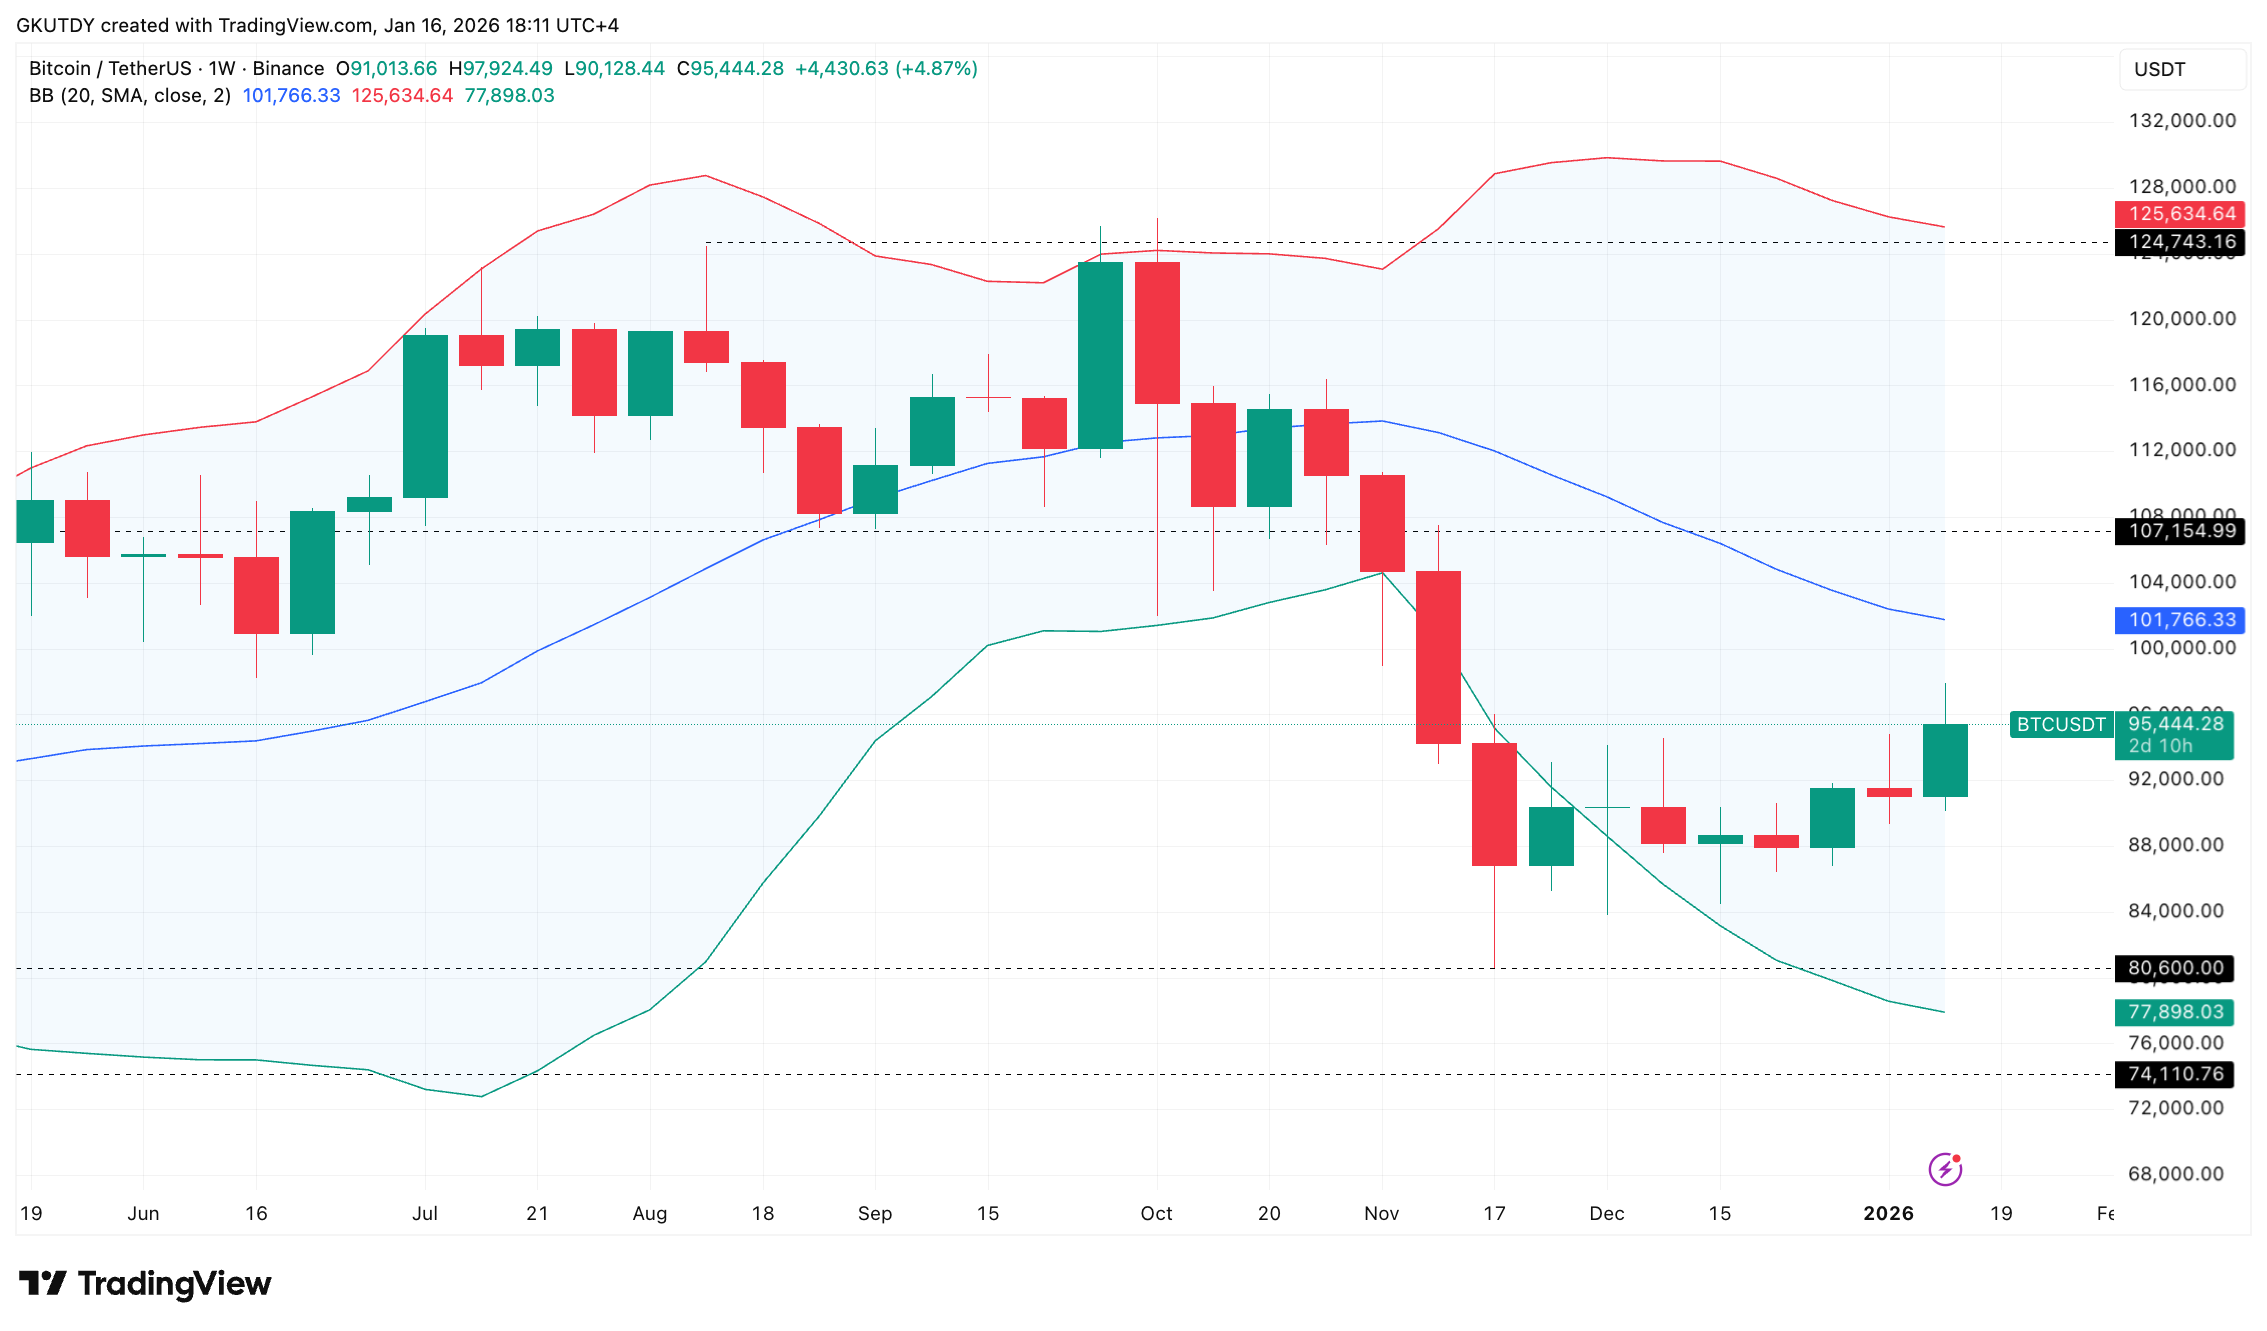
The 20-week moving average — which is also the middle of the Bollinger Bands — is sitting right at $100,000 per BTC. At first glance, it seems like the next obvious breakout zone.
But the ugly truth is that Bitcoin has been struggling to break through that resistance since October, and now it is back to testing it with increased volatility and lower trading volume.
What's more, two key weekly moving averages — the 23-week and the 50-week — are bending into a potential death cross right around the same price. This is not a minor crossover in a short time frame. It is a rare, high-signal setup that often marks macro pivot points. If that cross completes, Bitcoin risks staying below six figures much longer than bulls are expecting.
Triple resistance for Bitcoin
Take a look at the daily chart, and you will see another resistance pop up: the 200-day moving average. It is sitting just above $99,000, which puts more pressure on the market, squeezing price action into a triple-layer resistance wall.

Thus, while everyone is rushing into the long side again, hoping for a clean break to $107,000 or even the post-ETF target at $124,000, the price history reminds us that the "irst kiss" of the Bollinger's midband after a correction does not come easy — and often fails.
Bitcoin might still punch through. But if it does, it will not be because of the trend lines. It will be in spite of them.
 Dan Burgin