For the third most popular cryptocurrency, the week has not started off bad – its rate rocketed by almost 3% just in 1 hour.
According to the statistics, the trading volume over the past 24 hours makes up around $1 billion.
Both fundamental and technical factors affect the price change. Taking into consideration the first one, a few days ago, Ripple transferred a total of 107,000,000 XRP in the amount of $36.1 million. One of the transactions in this amount was selling about $6.7 million of its digital assets to a third party. It means that the network is being widely used by large businesses.
Now, let’s get into the details of technical analysis.

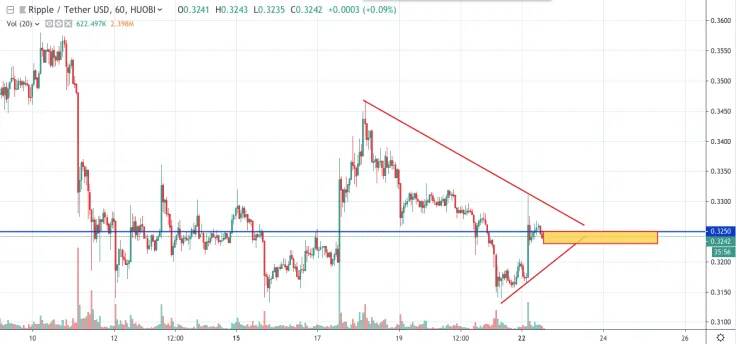
The 1-hour chart indicates the creation of a Triangle pattern pushing the price to $0.3250. During the last week, buyers were fighting against sellers for this zone, and the quotes fluctuated above and under this point all of the time. Currently, it is crucial to fix in the corridor of $0.325 - $0.33 in order to consolidate efforts and move forward.
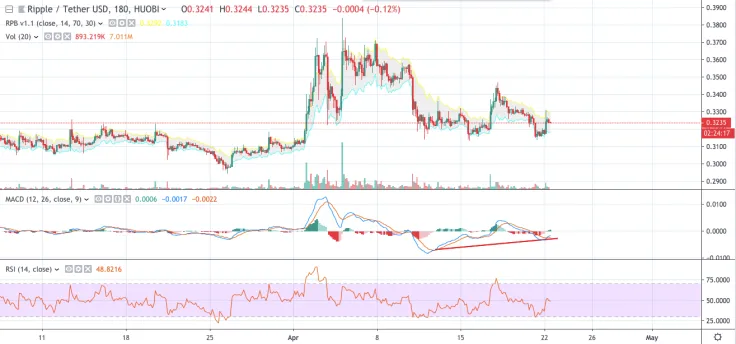
According to the 3-hour chart, it tells us that the quotes are trading at the lowest levels and a bounce back should definitely occur. In this regard, let’s analyze the MACD and RSI indicators.

The first one explains that the coin is still in the bullish wave and achieving $0.33 and later, $0.35 is a matter of time.
The RSI indicator is located in the oversold zone, suggesting that sellers are running out of steam, and buyers will come back soon.
What is more, these factors are confirmed by trading volume, which keeps increasing.

 Vladislav Sopov
 Dan Burgin