Disclaimer: The opinions expressed by our writers are their own and do not represent the views of U.Today. The financial and market information provided on U.Today is intended for informational purposes only. U.Today is not liable for any financial losses incurred while trading cryptocurrencies. Conduct your own research by contacting financial experts before making any investment decisions. We believe that all content is accurate as of the date of publication, but certain offers mentioned may no longer be available.
On Feb. 25, 2026, XRP climbed 6% in a single day, closing at $1.44 on Binance, according to TradingView, after opening near $1.35.
This increase followed a rough start to the year. XRP had already dropped 10.6% in January and an additional 13.8% in the first part of February. This significant daily increase is notable because it occurred when key technical indicators turned positive.
Where does $1.50 for XRP prediction come from?
Look at the daily chart, where the Bollinger Bands — a widely used tool that measures price volatility — now show the upper band at $1.51. The middle band is at $1.42, and the lower band is at $1.34. The price of XRP closed near the middle band and is pushing higher. If the buying continues, this setup is a clear sign that $1.50 is the next realistic target.
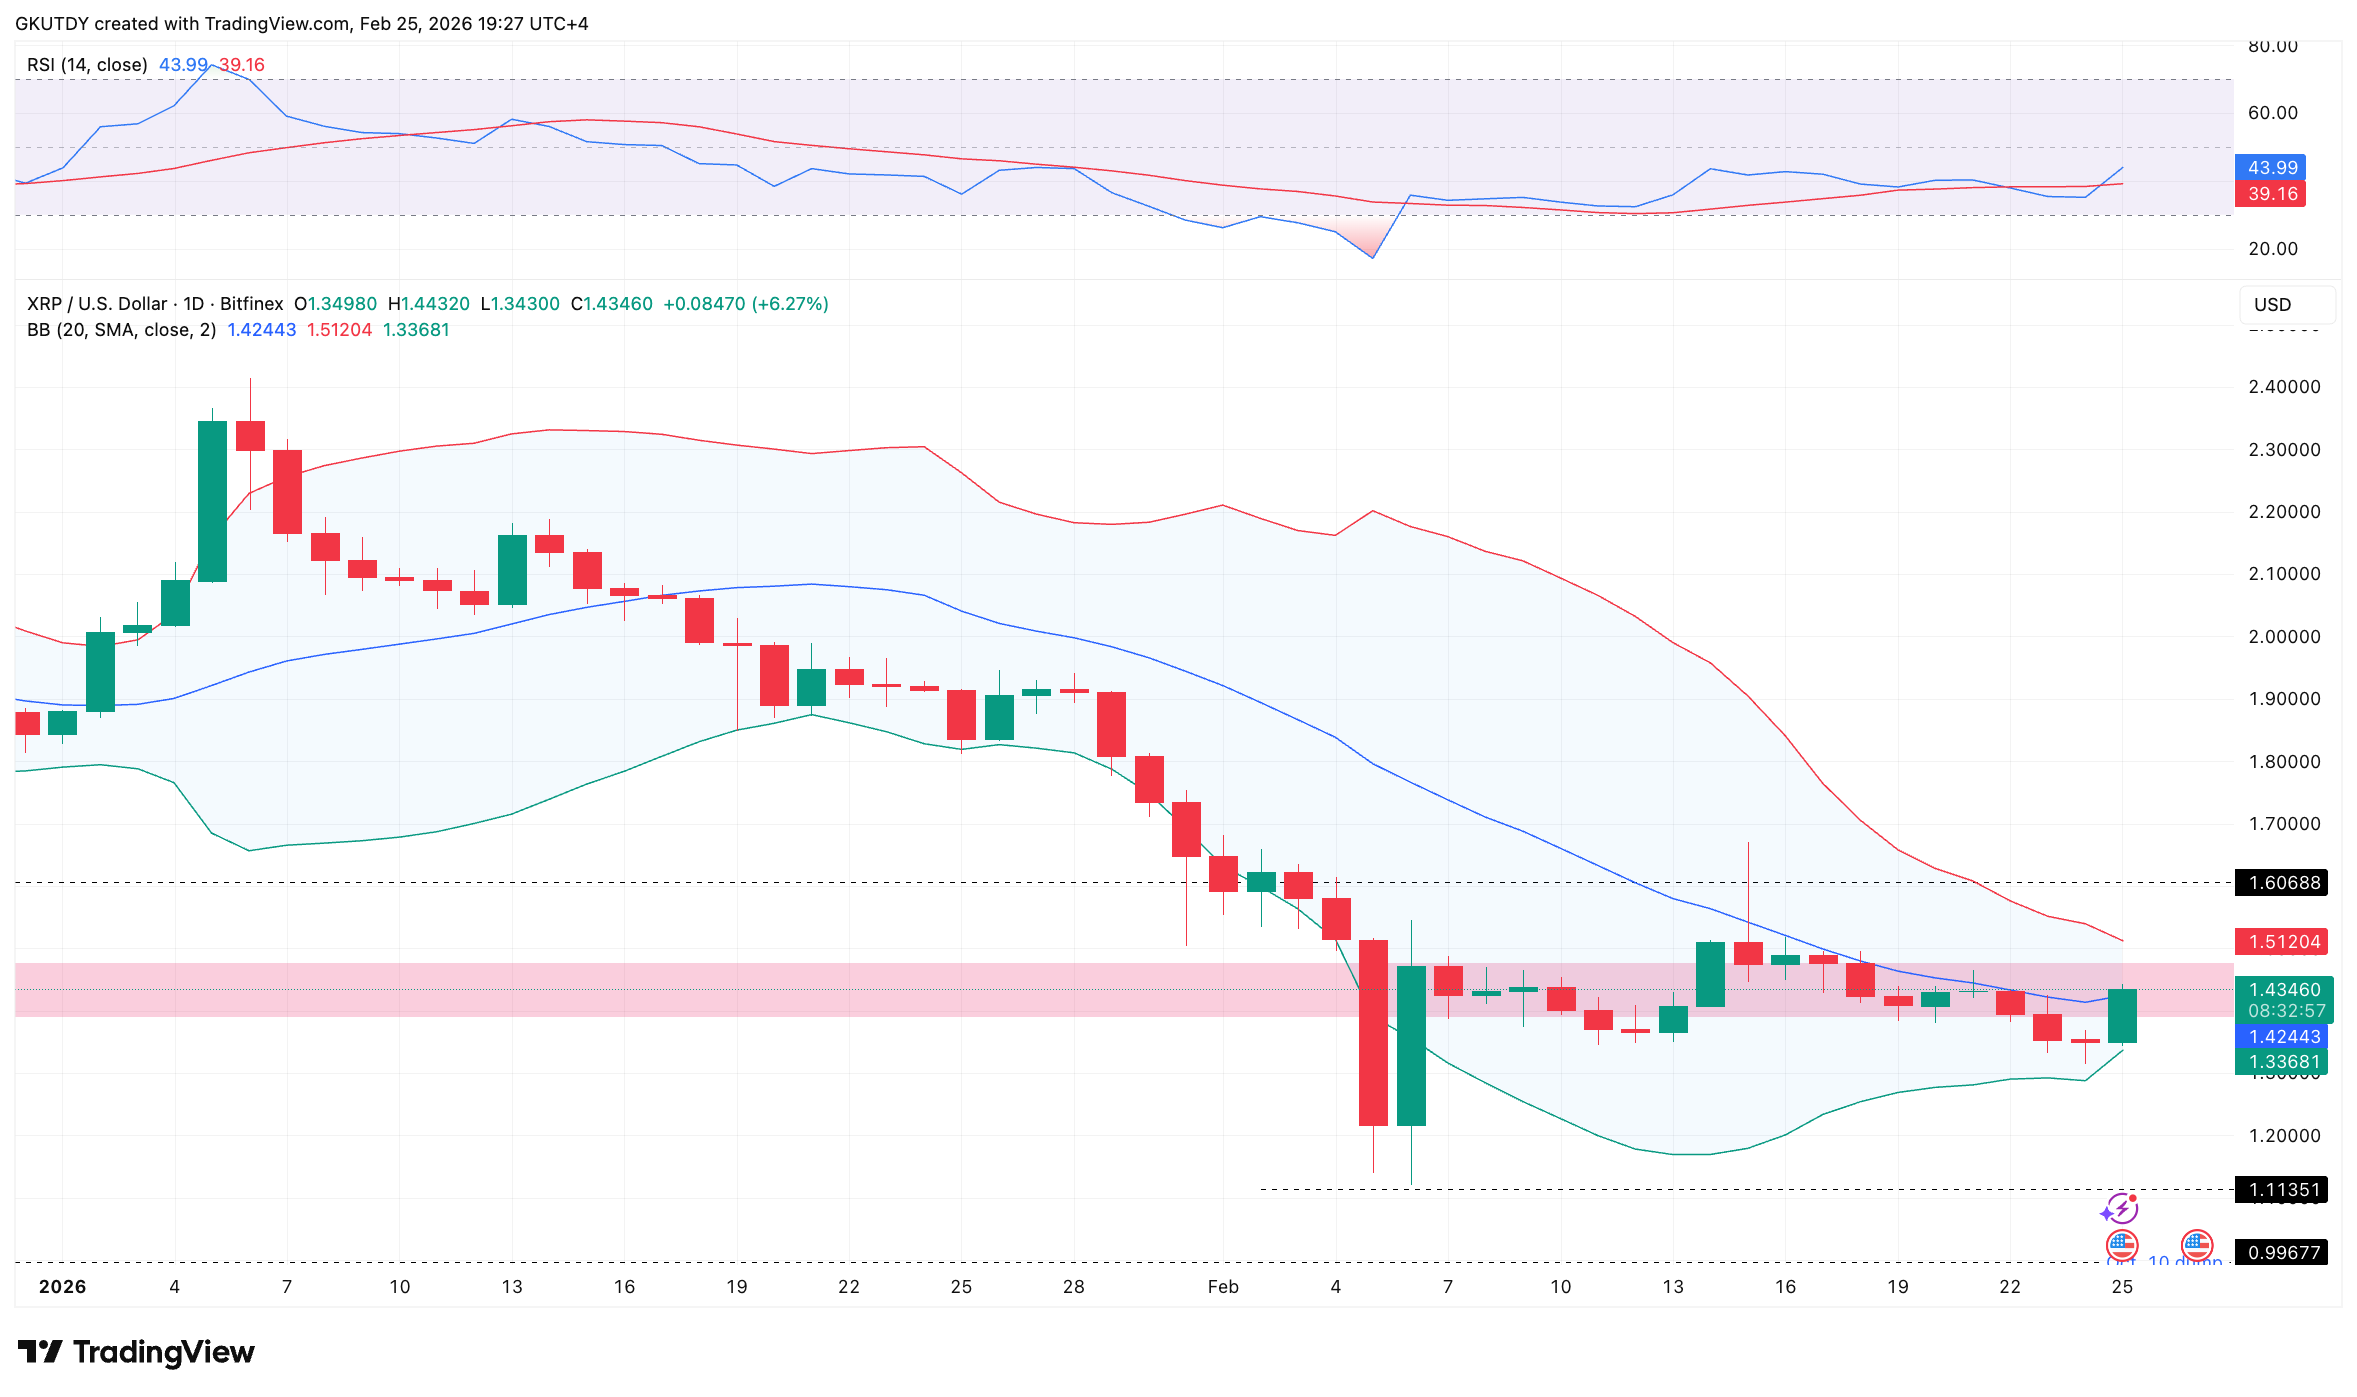
Additionally, the 14-day RSI sits at 44.75. This remains in neutral territory, indicating there is potential for further upside without the coin becoming overbought.
Historically, February has been one of XRP’s weakest months. Data going back to 2013 shows a median February return of -9.02%. However, the same data shows strong average gains in March (+18.1%) and April (+24.8%), which often follow weak February performances.
For now, the focus is simple: can XRP hold above $1.42 and push through the upper Bollinger Band near $1.51? If so, the path to $1.50 will be much smoother. The next few days will be closely watched by traders as a close above $1.51 on decent volume would confirm a shift from weakness to strength.
 Dan Burgin
 U.Today Editorial Team