

Disclaimer: The opinions expressed by our writers are their own and do not represent the views of U.Today. The financial and market information provided on U.Today is intended for informational purposes only. U.Today is not liable for any financial losses incurred while trading cryptocurrencies. Conduct your own research by contacting financial experts before making any investment decisions. We believe that all content is accurate as of the date of publication, but certain offers mentioned may no longer be available.

After a decline that dominated the majority of the year, XRP is alive again. On the daily chart, the asset, which is currently trading at $1.13, has clearly formed an ascending triangle. This pattern is frequently linked to bullish continuation or reversal attempts.
The structure indicates that buying pressure is steadily building even though the breakout has not yet happened. The sequence of higher lows that have developed throughout July is the most prominent aspect of XRP's present configuration. There is a rising support line beneath price action because buyers have been drawn to each pullback earlier than the last.
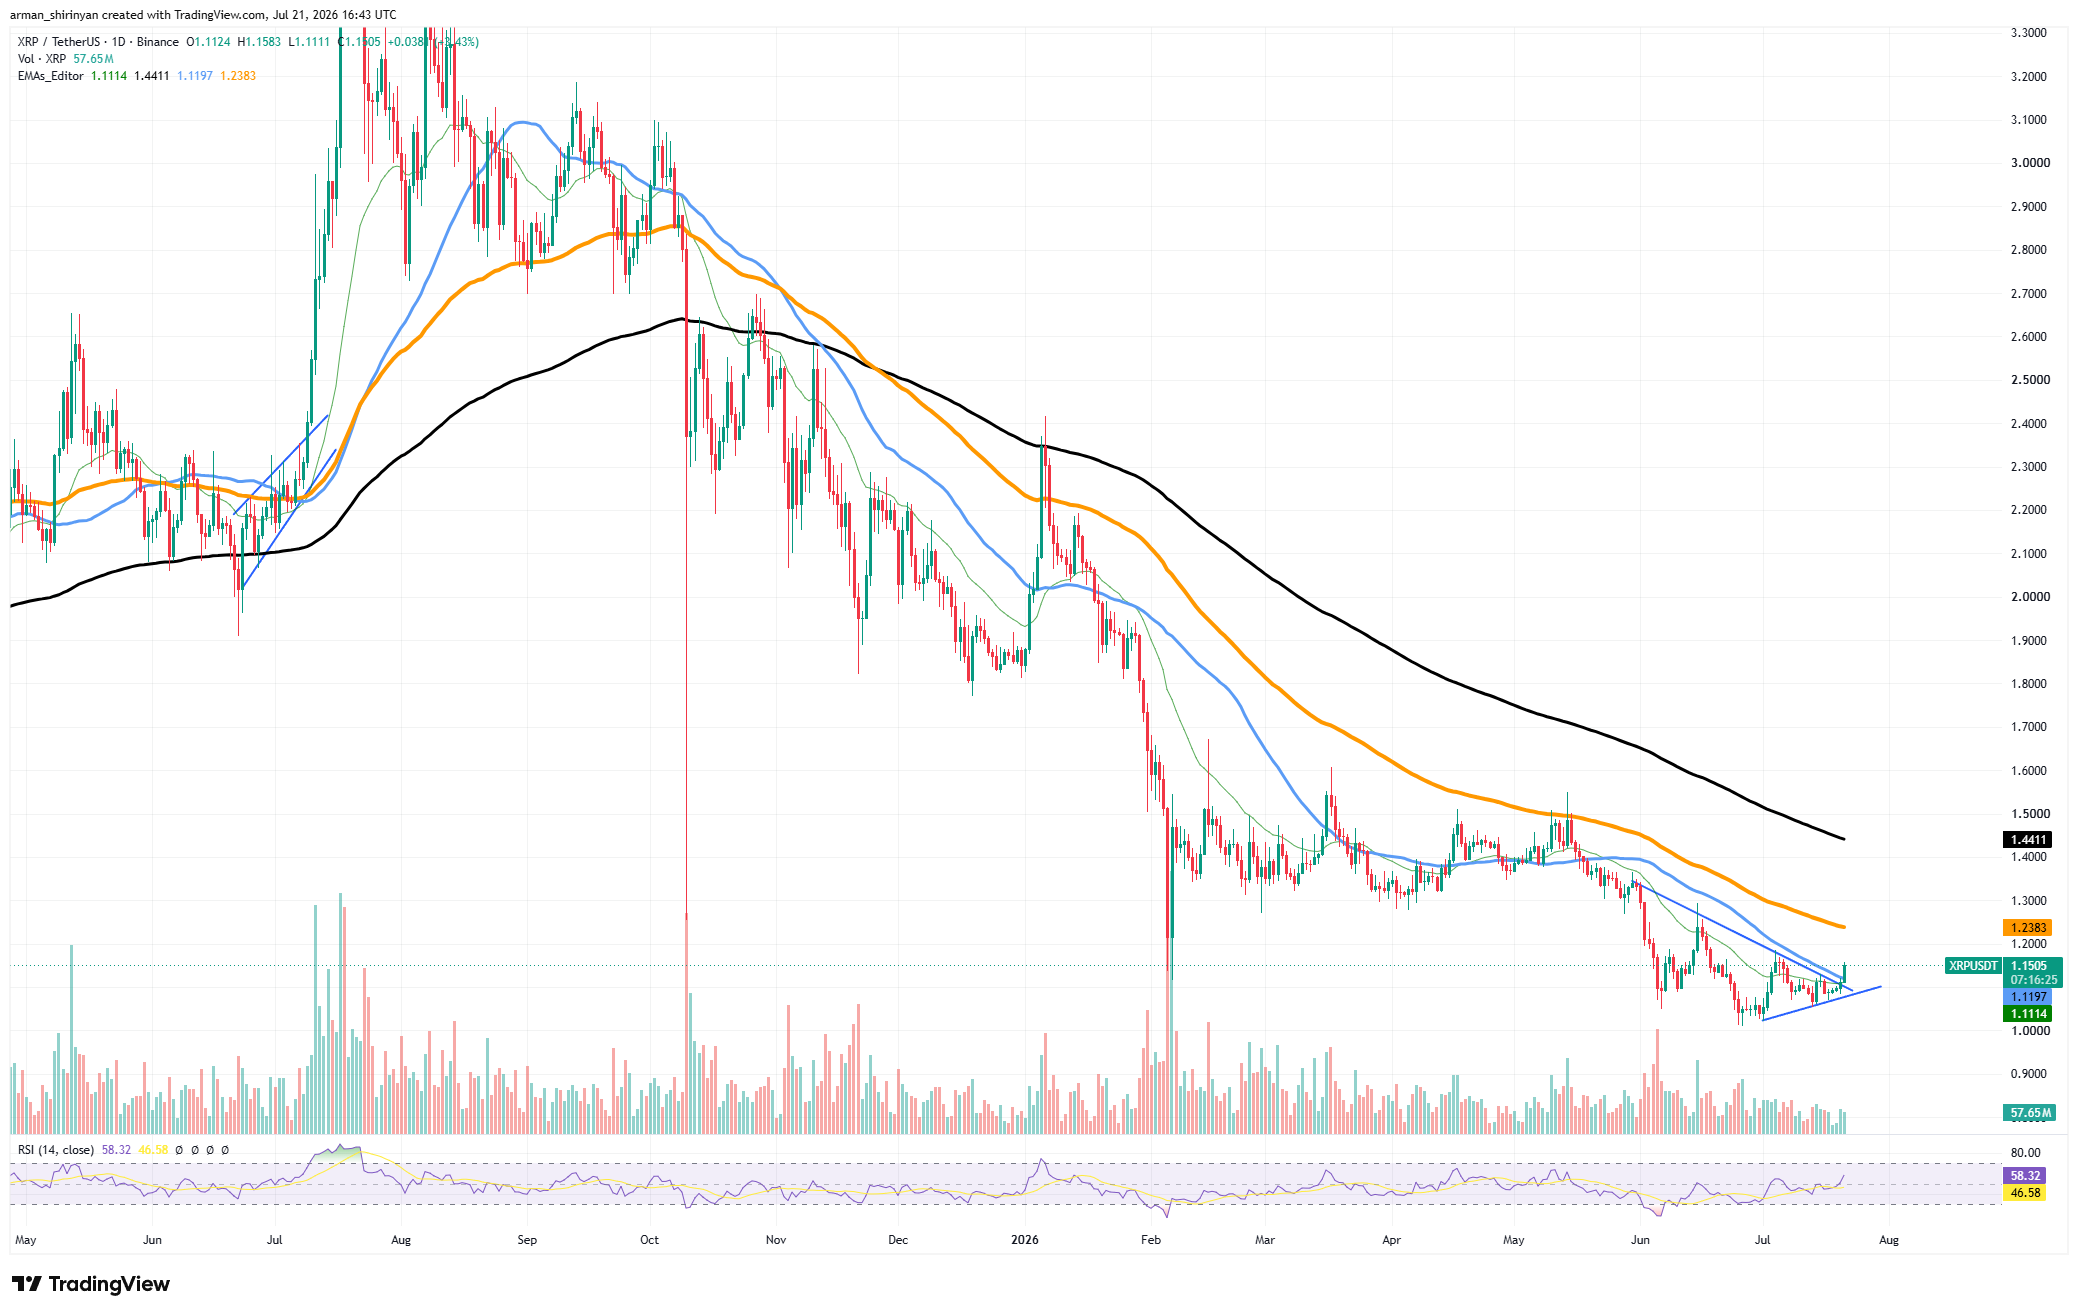
Concurrently, XRP is still testing resistance from a group of moving averages that are directly above it. Usually, a powerful directional movement resolves this compression between support and resistance. Near the 50-day EMA at $1.17 is the first significant barrier. The focus would shift to the 100-day EMA around $1.24 if a close above that level were successful.
After that, bulls would move on to the psychologically significant $1.30 area. Additionally, momentum indicators are improving. After months of weakness, the RSI has risen above the neutral 50 level, indicating a change in sentiment. However, trading volume is still low, suggesting that the market is still awaiting confirmation before making large capital commitments.

While XRP is trading below its longer-term moving averages, especially the 200-day EMA around $1.44, the overall trend is still negative. However, this is one of the strongest price structures seen in a few months.
XRP may enter a much longer recovery phase if buyers are able to overcome the current resistance. On the other hand, the asset would be vulnerable to another decline toward the $1.05–$1.00 support zone if the rising trendline support were lost, invalidating the bullish setup.
Cardano's recovery potential
One of Cardano's longest stretches of persistent weakness is slowly coming to an end. ADA, which is currently trading at $0.175, has spent the past few weeks regaining important short-term moving averages while laying a foundation above its June lows. The technical picture has significantly improved, even though the asset is still far below significant long-term resistance levels.
ADA's breakout from the horizontal consolidation range that dominated price action for the majority of the spring is among the most significant developments. Before eventually drawing enough buying pressure to move higher, the asset moved sideways for months in the $0.15-$0.16 area. A higher low structure was established by that breakout, which also turned the momentum back to buyers.
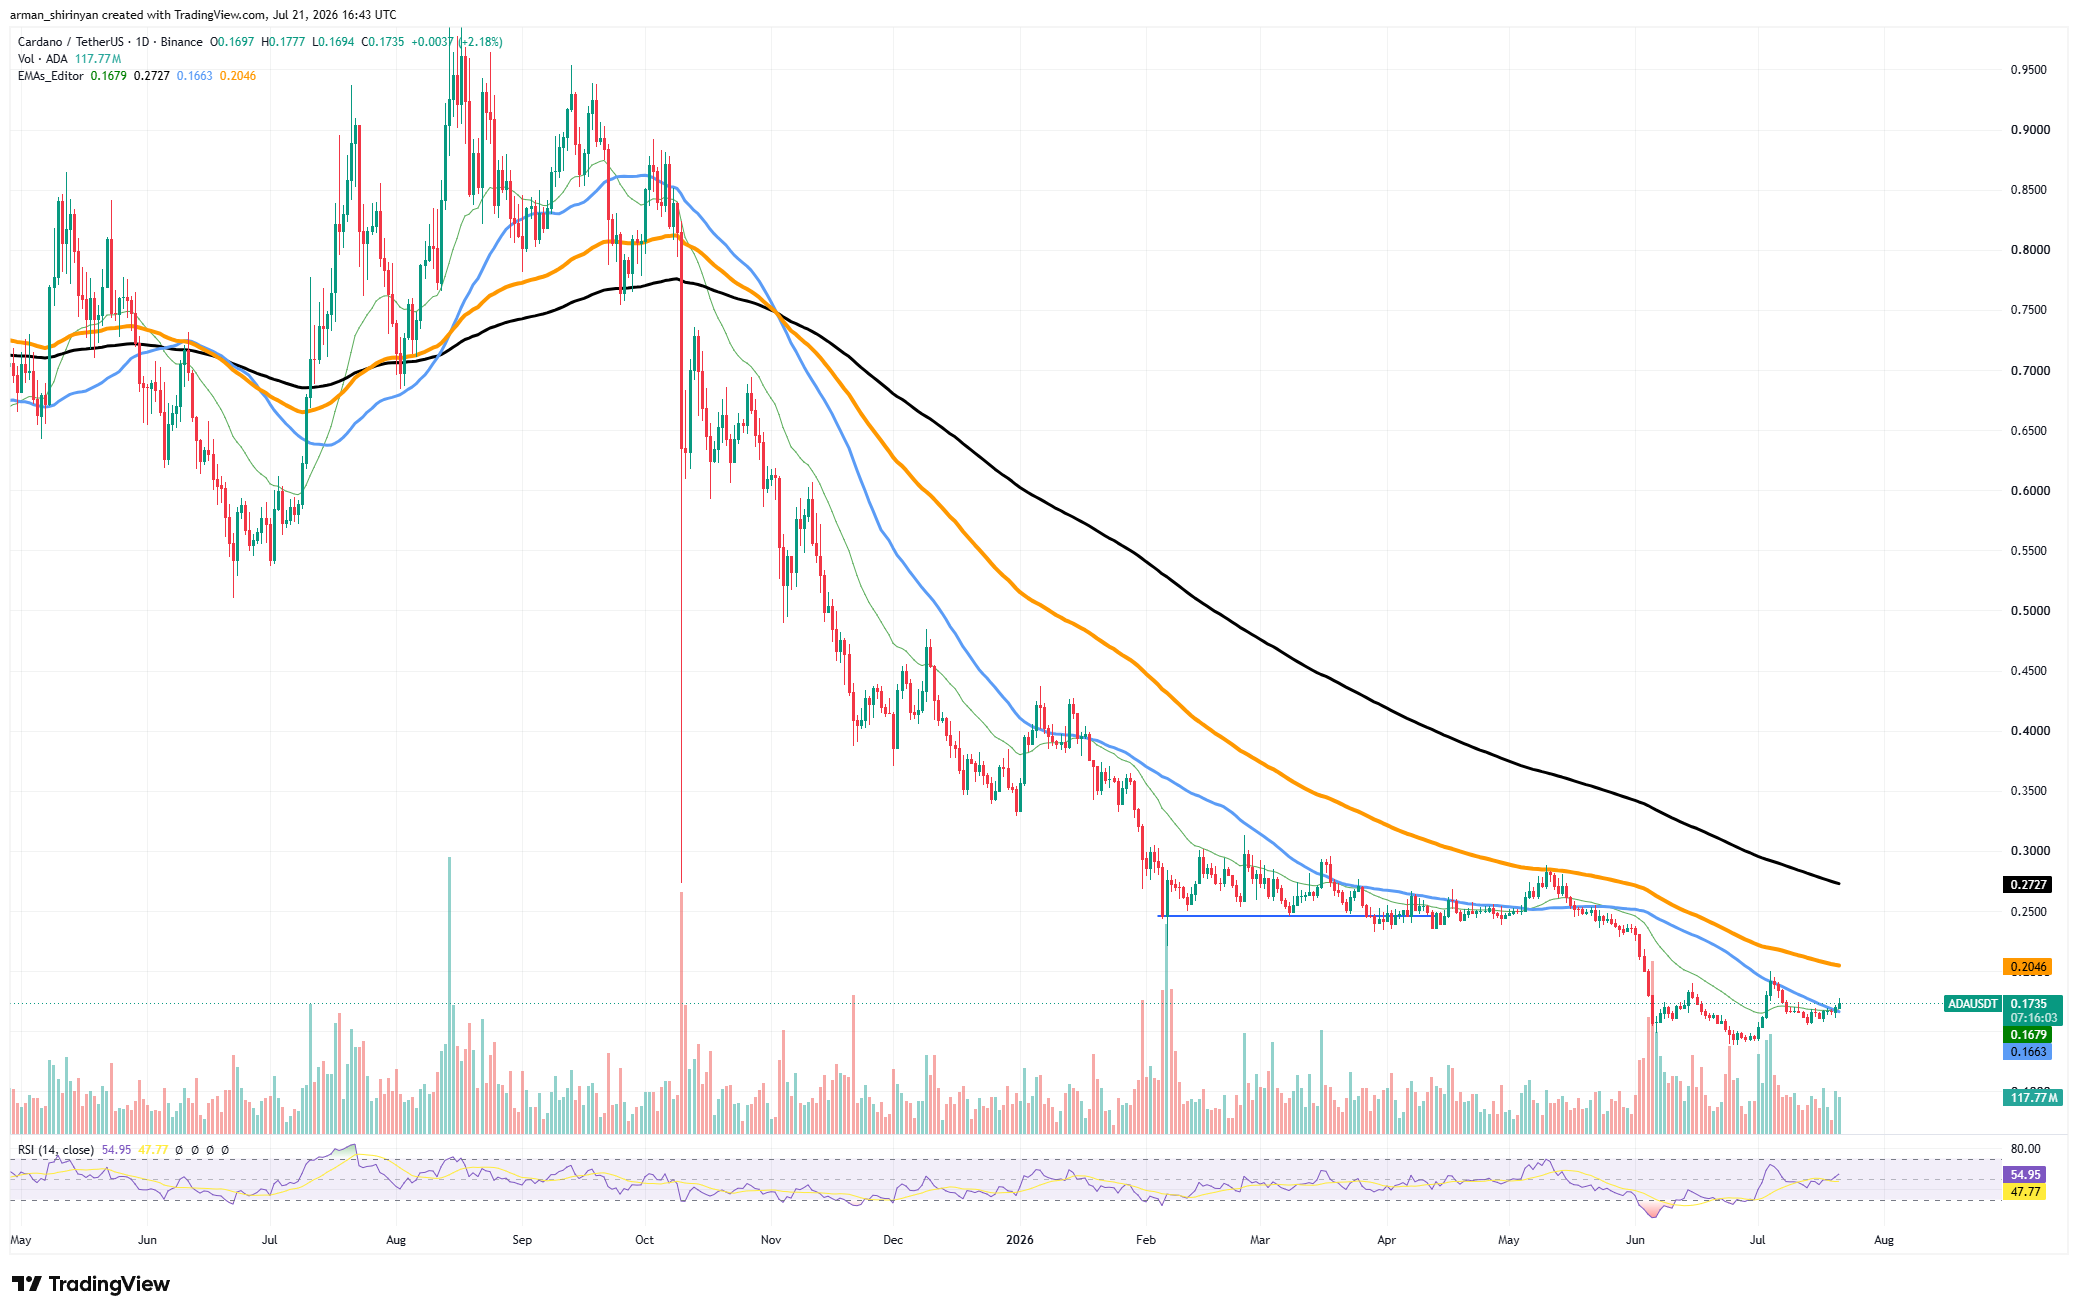
Following the initial recovery rally, price action has stabilized thanks to the support provided by the 20-day and 50-day EMAs. In the meantime, the RSI has risen above 56, suggesting that bullish momentum is getting stronger without getting close to overbought territory. If market conditions continue to be favorable, this allows for further upside. The next important level is located around $0.20, close to the 100-day EMA.
This region denotes a significant psychological threshold as well as technical resistance. ADA's outlook would be greatly enhanced by a clear move above $0.20, which might also lead to a wider advance toward the $0.22-$0.25 range.
Additionally, volume activity has improved since the first half of the year, indicating a resurgence of market participation. Even though the long-term trend is still improving, ADA seems to be building a foundation for a more significant reversal later in the year.
The $0.16 support zone is still crucial for the time being. The current recovery will continue as long as Cardano stays above that area, and there is a high likelihood that it will continue to rise toward higher resistance levels.
Stellar's clear recovery
Among the major altcoins, Stellar is quietly building up one of the cleanest recovery structures in a while. After rising from its June lows, the asset has been consolidating above important moving averages for the past few weeks, currently trading close to $0.19. The technical picture has significantly improved since the first half of the year, even though the overall trend is still cautious.
The convergence of the 20-, 50-, and 100-day EMAs around current price levels is one of the most significant developments. This compression frequently indicates an impending increase in volatility, and XLM seems to be getting close to that turning point. Despite multiple attempts by sellers to drive it lower, the asset has consistently maintained the $0.18 support zone. Market participants are once again paying attention to Stellar, as evidenced by the enormous volume spikes in June.
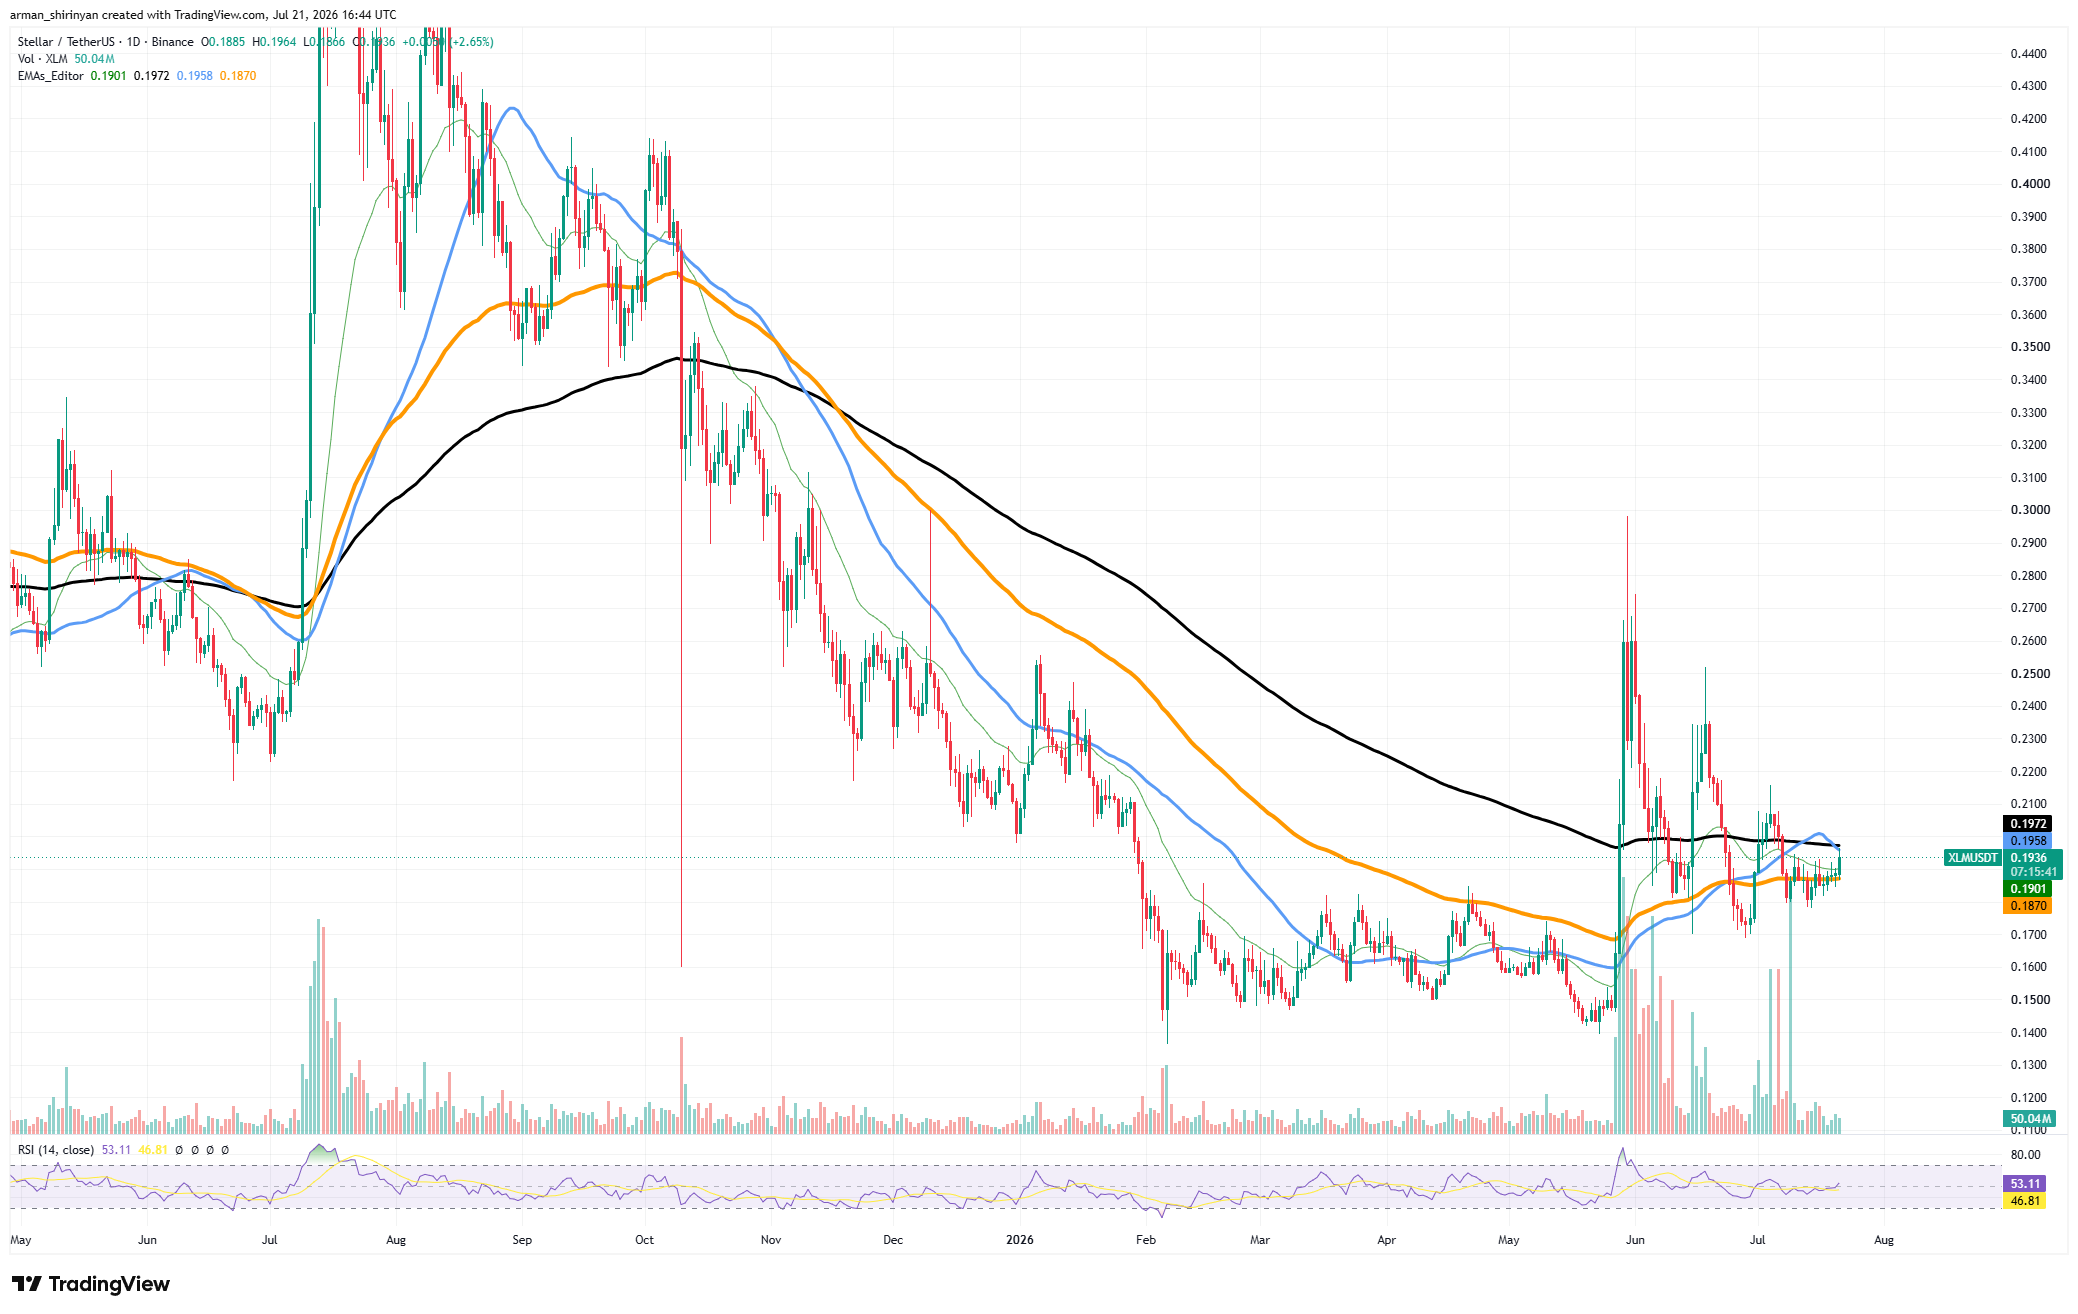
Even though those rallies were initially rejected, the pullbacks that followed did not result in lower lows, indicating that buyers are progressively absorbing supply. This narrative is supported by momentum indicators. Before overbought conditions become a concern, the RSI is holding close to 52, providing ample opportunity for additional upside.
The next targets appear close to $0.23 and $0.25, where prior rallies stalled, if bulls can push XLM above the $0.20–$0.21 resistance zone. The key level is currently $0.18. By staying above it, the recovery is maintained and the potential for a more significant trend reversal is preserved.
Any significant breakout attempt would be postponed if there were a breakdown below that support, which would probably draw attention back to the $0.16 region.
Bitcoin is rebounding
The top cryptocurrency, Bitcoin, is currently trading at about $66,300 as it continues to rebound from its severe decline in June. After being under pressure for weeks, Bitcoin has finally started to establish a sequence of higher lows, indicating that buyers are progressively taking back control of the market.
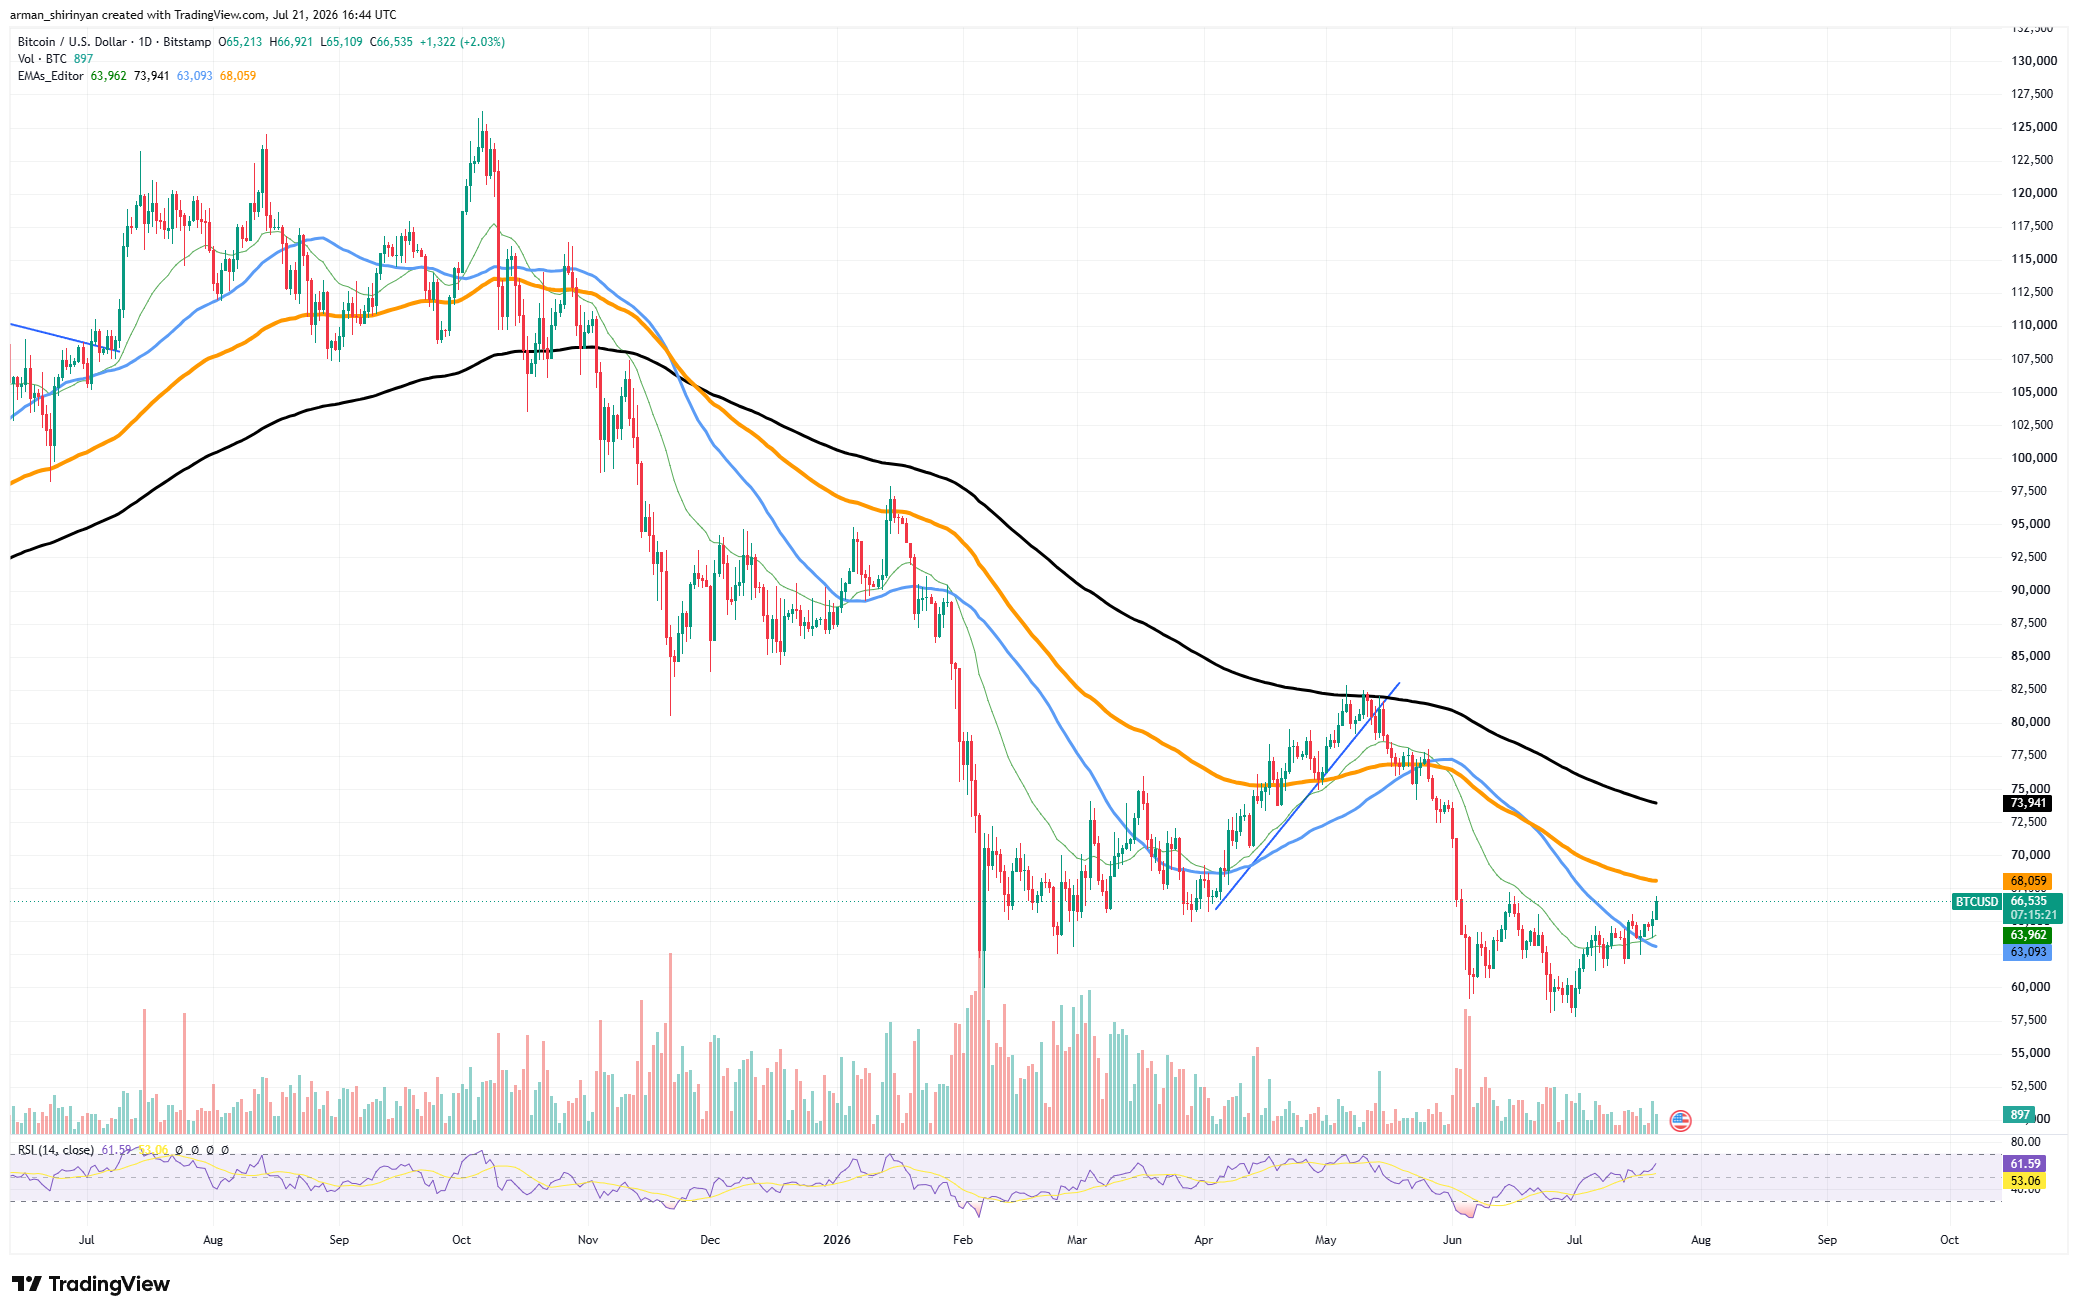
Bitcoin's market structure has significantly improved as a result of the recent recovery, which has propelled it back above both its short- and medium-term moving averages. But the biggest obstacle is still directly above. Throughout the recent decline, the 100-day EMA, which is now close to $68,000, has frequently halted attempts at upside.

This means that in the near future, the $68,000 area will be the crucial battlefield for Bitcoin. A clear breakout above it could pave the way for the $72,000-$75,000 range and greatly bolster bullish momentum. After months of decline, such a move would also put BTC back in a stronger medium-term trend.
The RSI has risen above 60, indicating a rise in buying pressure without entering overheated territory. Additionally, volume has stabilized, indicating that the panic selling that occurred in June has mostly stopped.
Support between $63,000 and $64,000 is still crucial on the downside. The current recovery is sustained as long as Bitcoin stays above that range. Whether Bitcoin can reclaim the $68,000 mark and demonstrate that a more sustainable advance is in progress is currently the market's main concern.
 U.Today Editorial Team
 Dan Burgin
