

Disclaimer: The opinions expressed by our writers are their own and do not represent the views of U.Today. The financial and market information provided on U.Today is intended for informational purposes only. U.Today is not liable for any financial losses incurred while trading cryptocurrencies. Conduct your own research by contacting financial experts before making any investment decisions. We believe that all content is accurate as of the date of publication, but certain offers mentioned may no longer be available.

After one of its strongest rallies in recent months, Hyperliquid is getting close to the psychological $100 target; however, the most recent technical structure indicates that another large wave of buying pressure will be necessary to reach triple digits. After momentarily reaching about $87, HYPE is currently trading at about $80.83.
Hyperliquid's temporary pause
The asset traded below $60 in mid-August before quickly rising more than 40% and setting a new local high, indicating the size of the move. The moving averages are the first point in the bullish argument. On the daily chart, HYPE trades comfortably above each of the major trend indicators.
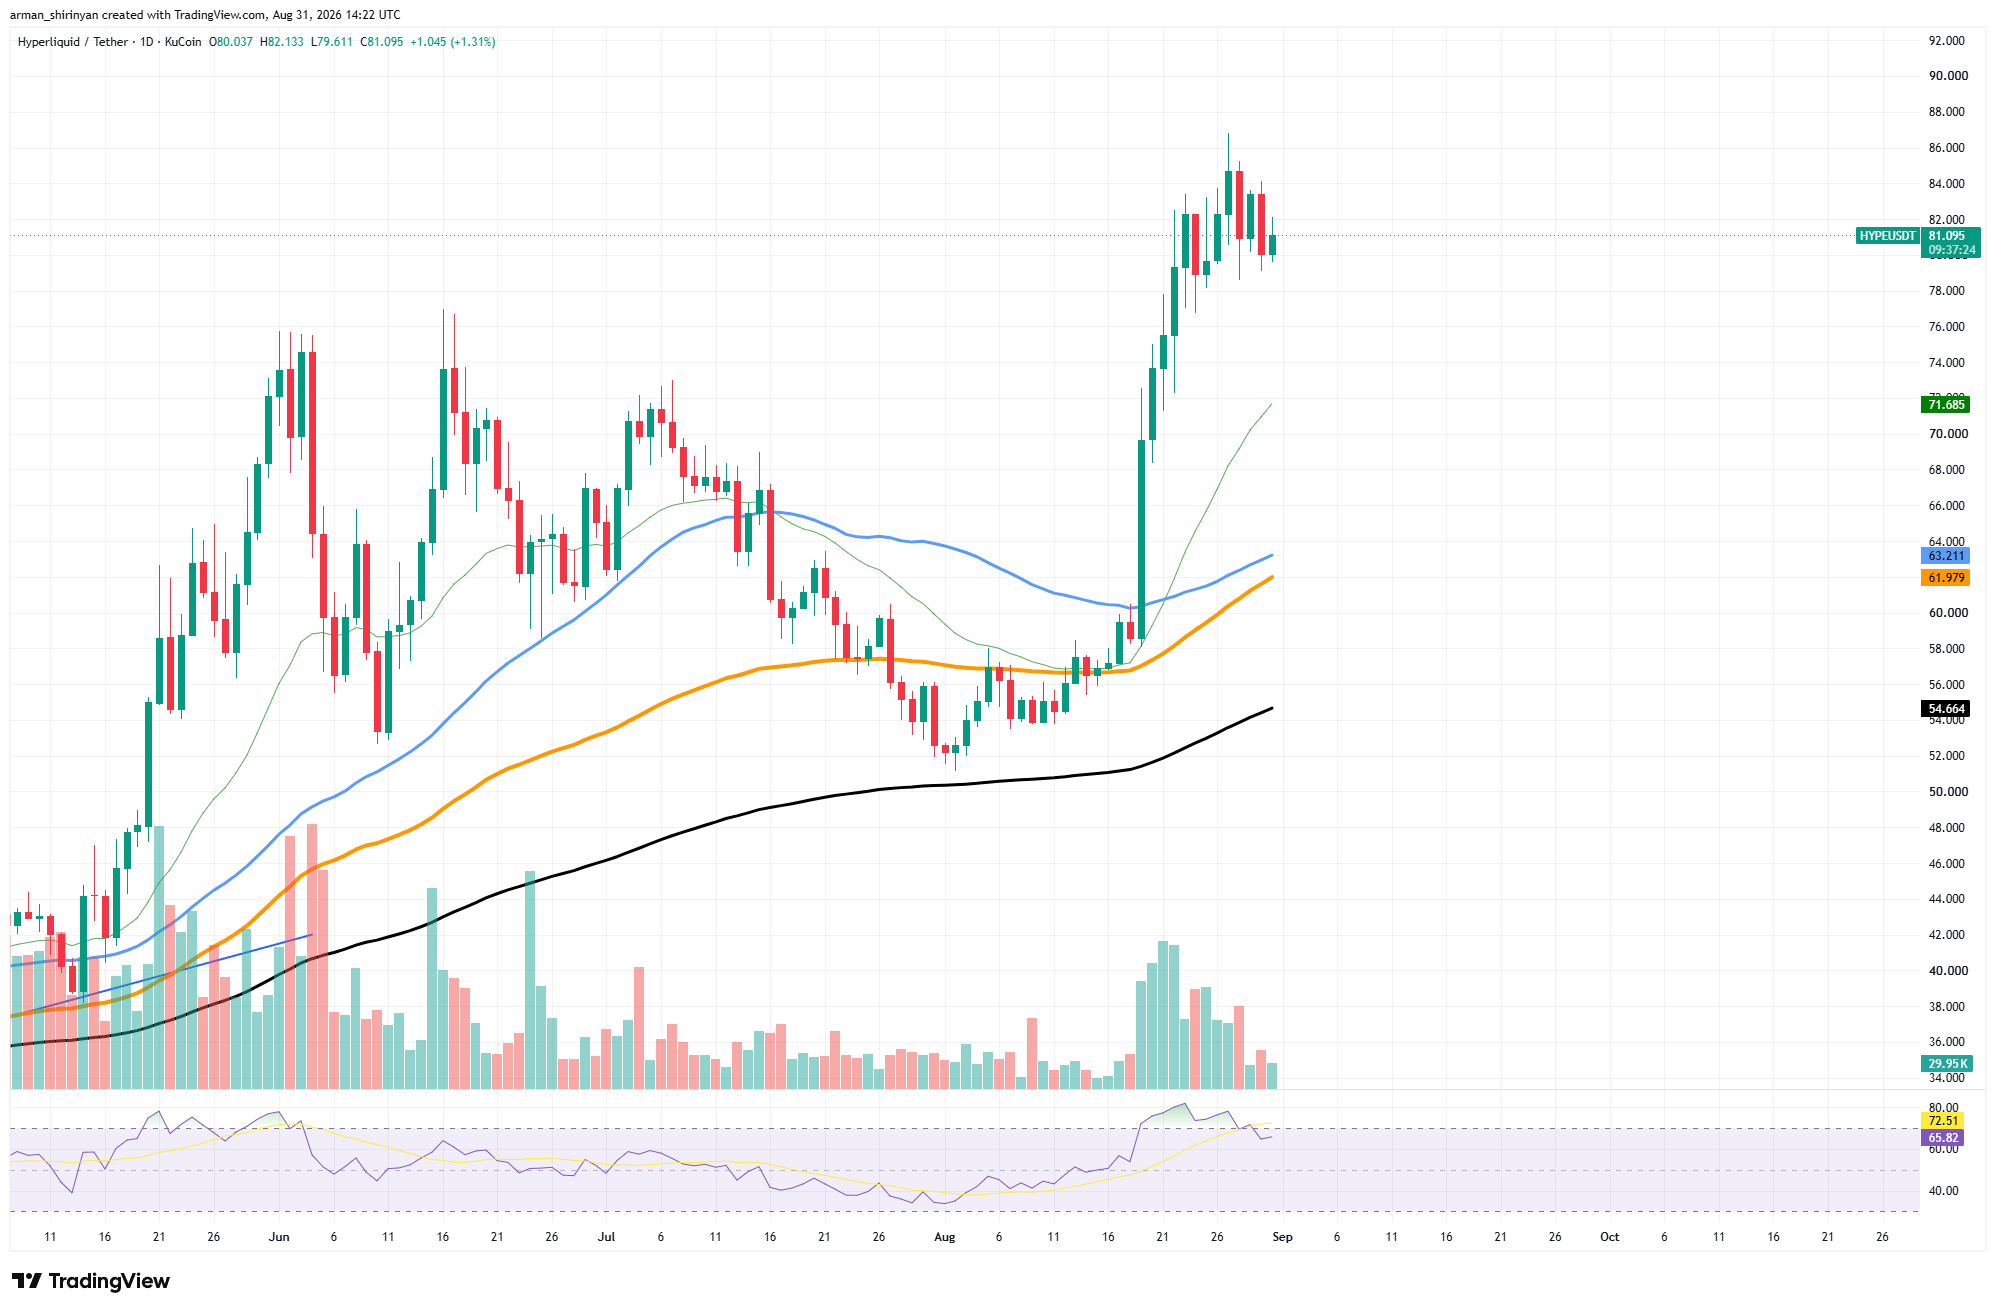
The 50-day and 100-day moving averages are at roughly $63.21 and $61.97, respectively, while the 20-day EMA has accelerated to about $71.67. At $54.66, the 200-day moving average is much lower. This structure demonstrates that HYPE is not opposing a more general bearish trend.
Rather, the main question is whether momentum can support an additional 24 percent increase from current prices to $100. The $85–$87 area is the first barrier. Selling pressure has already been applied to HYPE there, resulting in multiple upper wicks and delaying the most recent breakout.

Before the market can seriously challenge $100, a daily close above $87 would leave $90 as the next psychological barrier. The primary issue in the short term is momentum. The RSI recently moved above 70 and is currently at about 65. It is encouraging that the indicator has cooled significantly without collapsing, but it also indicates that the initial breakout impulse is weakening.
The story of trading volume is similar. As HYPE broke through $60–$70, volume increased sharply. However, as the price moved sideways around $80–$85, volume progressively decreased.
Any breakout above $87 would be strengthened by renewed volume. The immediate support range on the downside is between $78 and $80. Without necessarily disproving the bullish trend, a deeper retreat might move HYPE closer to the rising 20-day EMA at $71.67.
XRP reaches key levels
After giving back a significant amount of its August breakout gains, XRP has reached one of the most significant technical levels on its daily chart. The price is currently directly testing the 200-day moving average.
The 200-day moving average is close to $1.35, and XRP is currently trading at about $1.37. Because of how small the difference is, the market is already effectively testing this long-term support. This level is significant because XRP only recently recovered the 200-day average during its dramatic surge from roughly $1.00.
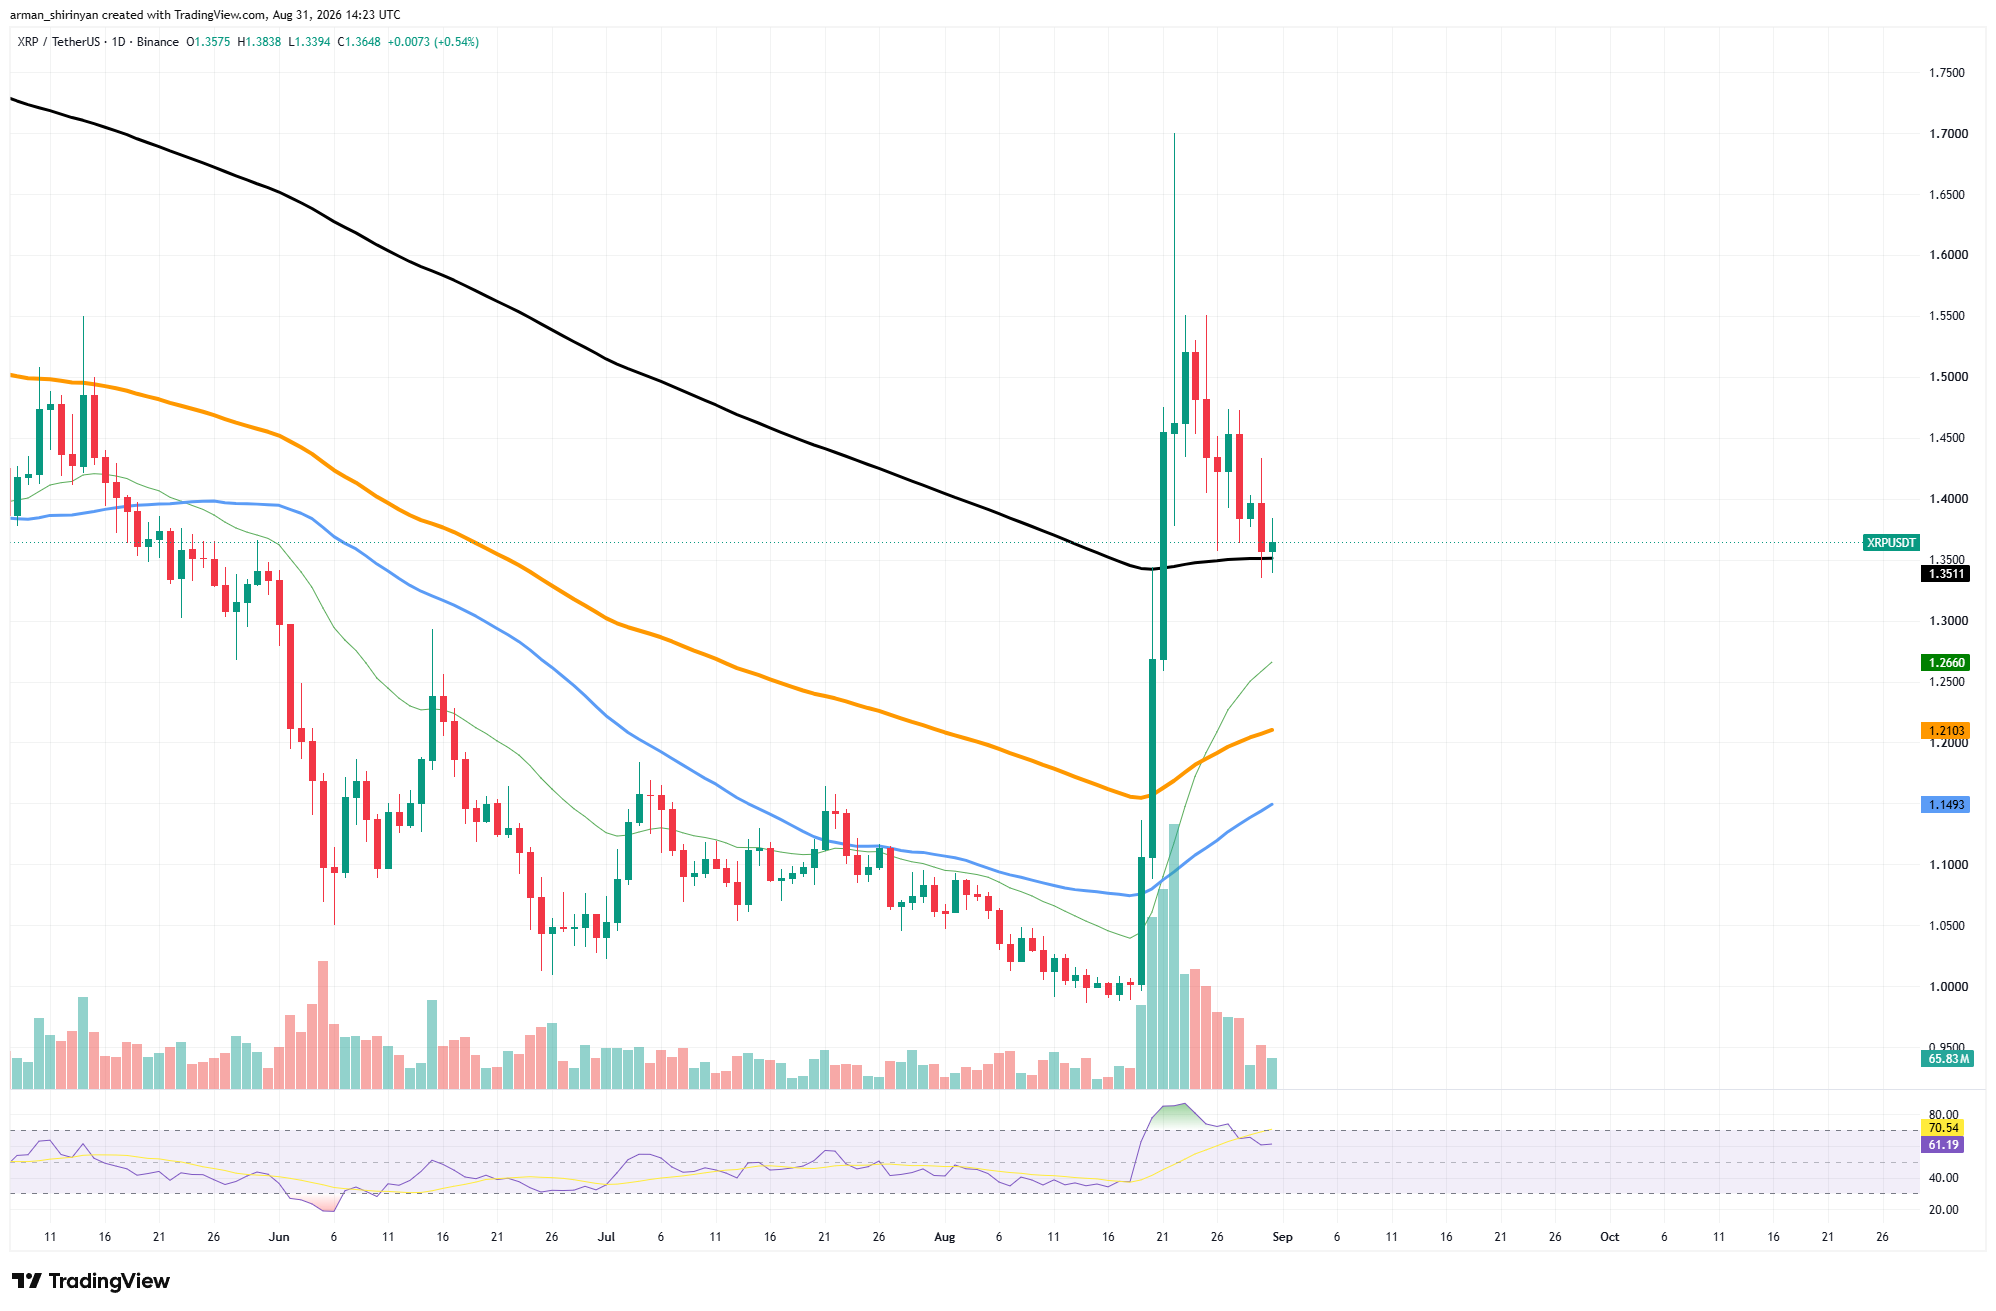
Before profit-taking took over and forced the asset back toward its breakout zone, the breakout drove XRP as high as $1.70. The bullish reversal structure would be strengthened if $1.35 were successfully defended.
XRP would indicate that the 200-day moving average may have flipped into support rather than plunging back under long-term resistance right away. There is already some indication of buying in this area in the current candle. XRP fell to $1.34 for a short while before rising above $1.36.

One intraday reaction, though, is not enough to guarantee that support will endure. Additionally, momentum has significantly decreased. After surpassing 80 during the first breakout, the RSI has dropped to about 61. Because XRP is no longer overbought, buyers have much more leeway to react if demand recovers at $1.35.
In contrast to the massive volume expansion that coincided with the initial breakout, volume has also steadily decreased during the correction. If $1.35 holds, XRP might try to get back to $1.40 before going after the resistance zone between $1.45 and $1.50. If $1.50 is broken, the recent highs would once again be taken into consideration.
A decisive daily close below $1.35 marks the start of the bearish scenario. If so, the next significant dynamic support is much lower, with the 100-day moving average close to $1.21 and the 20-day EMA around $1.27.
Solana isn't giving up
Following its spectacular August breakout, Solana is refusing to give up the $100 level, with buyers consistently intervening whenever SOL gets close to the psychological threshold. According to the most recent structure, $100 has swiftly changed from being an upside target to the most significant short-term support for the market.
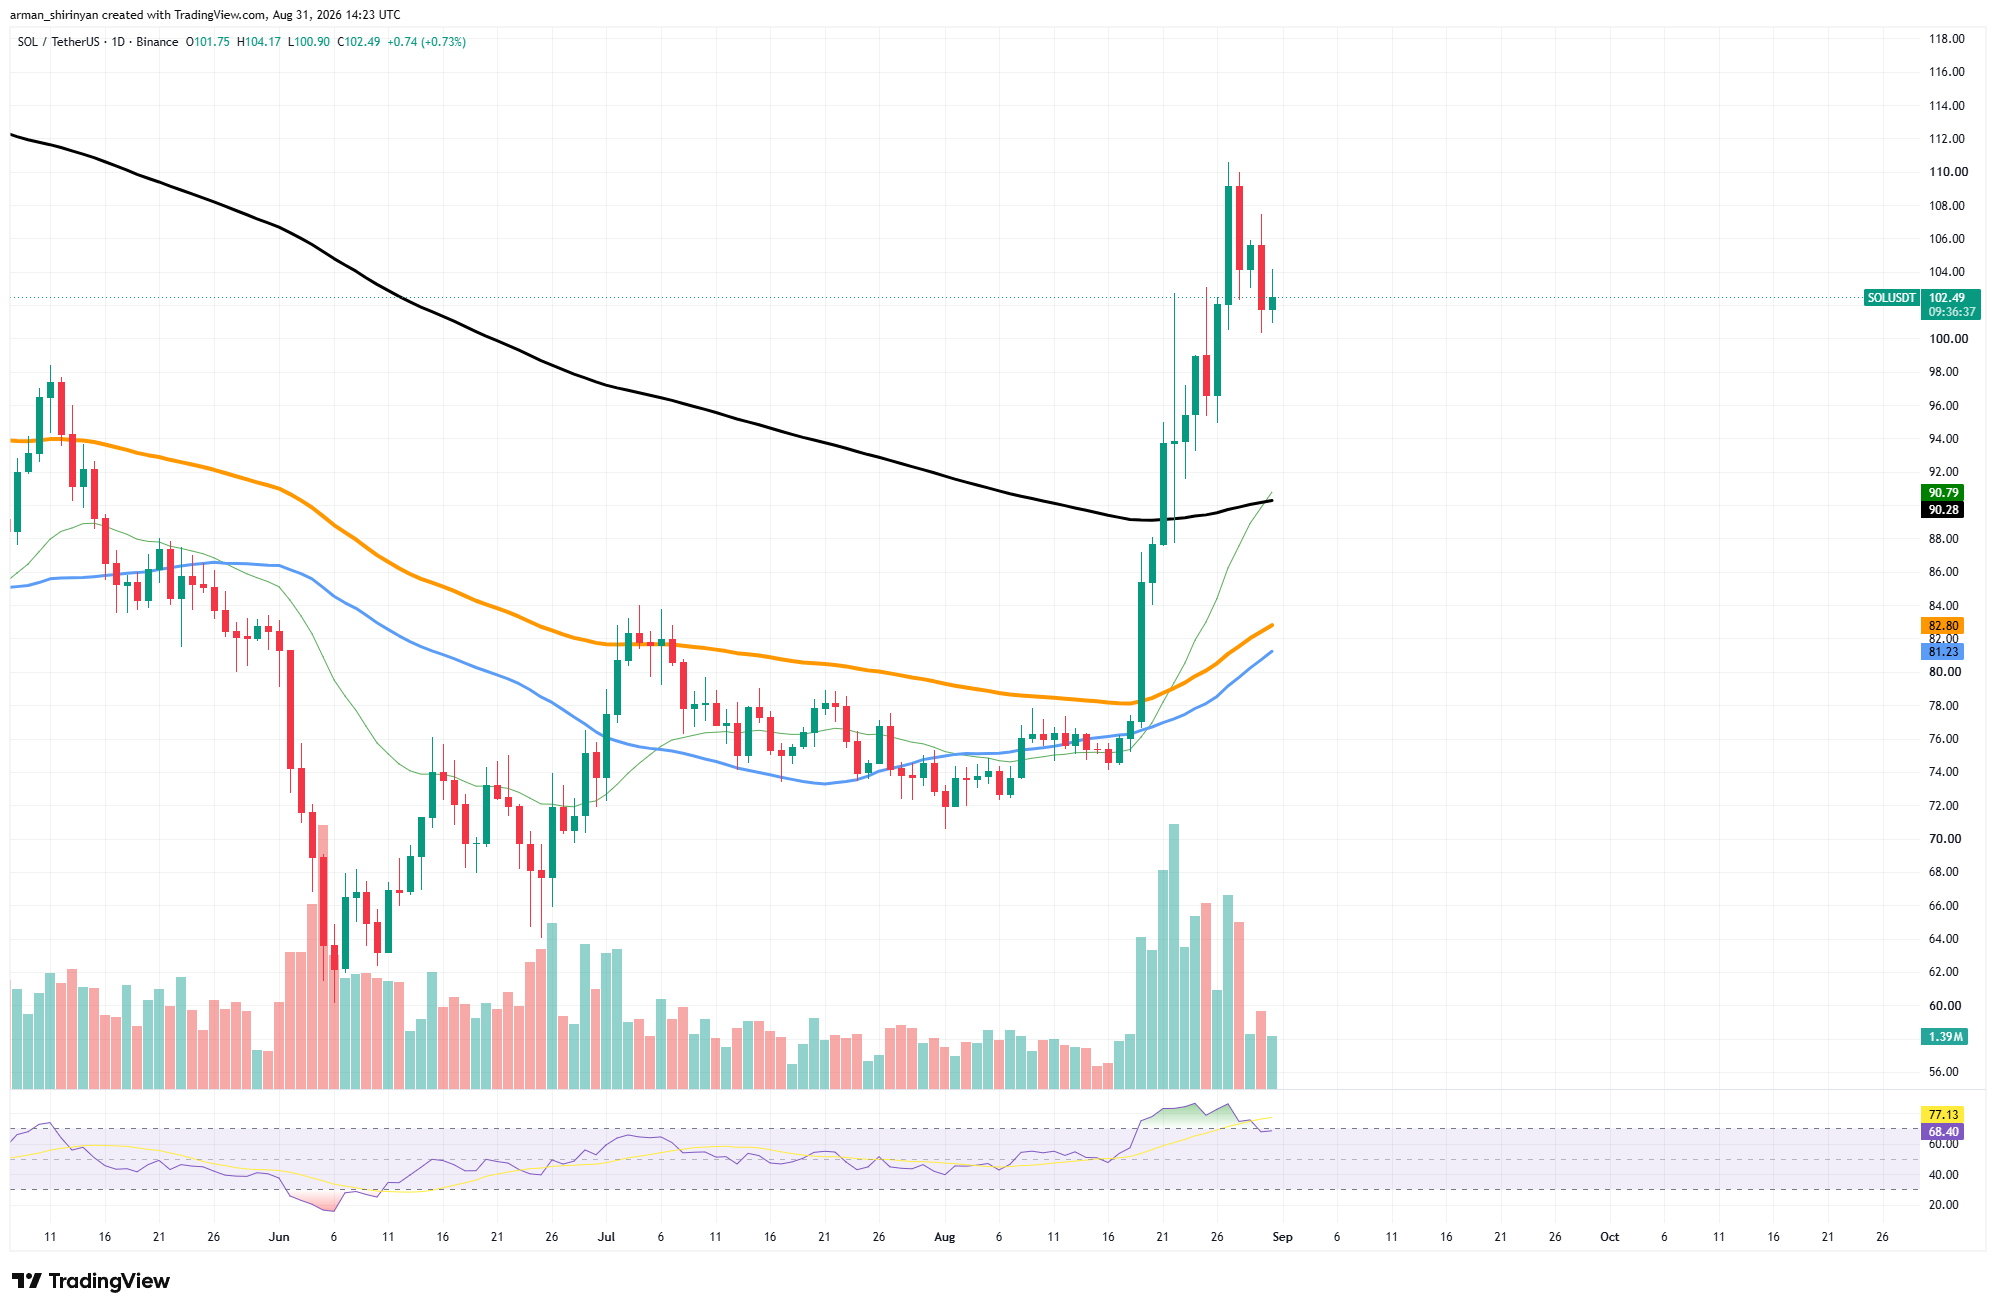
After hitting about $110 during the most recent rally, SOL is currently trading at about $102.70. Solana gained about 45% in less than two weeks before momentum began to slow down. The move started at about $75. Sellers have yet to generate a daily breakdown below $100, despite the correction from $110.
The most recent session saw SOL rise above $102 after hitting an intraday low of about $100.90. This defense is important because there is not much technical structure just below $100. At roughly $90, the strongest dynamic support cluster is still significantly lower. The 200-day moving average is currently close to $90.28, while the 20-day EMA has risen quickly to about $90.80.

If $100 eventually fails, their convergence creates a significant secondary support zone. But for the time being, Solana is still holding the psychological level. Momentum has moderated since the decline. The daily RSI moved deep into overbought territory before declining toward 69.
As a result, SOL maintains its relative strength without exhibiting the same extreme momentum conditions as the breakout's peak. In comparison to the massive activity seen during the initial move through $80–$100, volume is also decreasing.
This implies that the selling intensity caused by the most recent correction has not yet matched the buying pressure behind the breakout. The first barrier on the upside is $105, which is followed by the recent peak of $109–$110. In addition to confirming continuation, breaking $110 could pave the way for $115–$120.
If SOL closes firmly below $100, the bearish scenario becomes more pertinent. A retracement toward $95 and ultimately the $90 support cluster could be accelerated by such a move, which would eliminate the psychological floor. Following its vertical rally, Solana is still extended, so further consolidation would be expected.
 U.Today Editorial Team
 Dan Burgin
