
The cryptocurrency market continues to storm new local maxima. For many investors, it is a good sign in anticipation of the resumption of an upward trend.
The number of Bitcoin futures reached a record level, which generally indicates the presence of positive dynamics. Repeated testing of local minima looks unlikely in this case.
BTC/USD
Bitcoin was able to continue to grow after it dropped below $5,200. Although the price of the main cryptocurrency is rapidly increasing, its significant jump over the past few days has brought it closer to the formation of the world's first intersection of simple moving averages (SMA) for 20-200 days from October 2015 – a formation that usually occurs with a massive price jump.
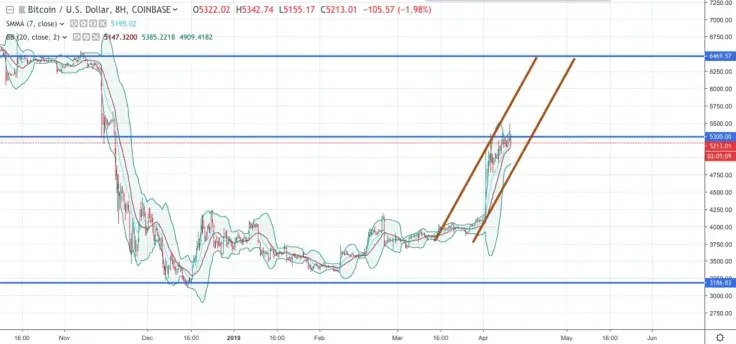
It is important to note that during the last week, Bitcoin repeatedly deviated from $5,300, which indicates that this price is a resistance level that may require a significant surge in consumer pressure to break higher.
The price of BTC is trading at $5,214.03 at the time of writing.
ETH/USD
A key bullish trend line was broken through with the support of $177 on the ETH/USD hourly chart. The pair even rose below the support level of $175 and formed a new intraday minimum of $170.06.
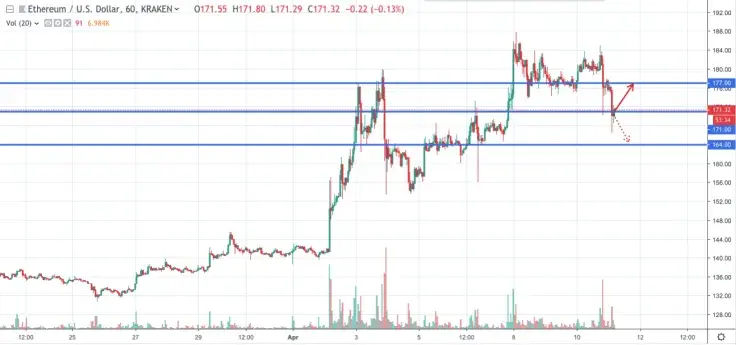
Analyzing the chart, the price of ETH has started a serious downward correction from the resistance of $184. Thus, there is a risk of a long fall below the support of $171. Having said that, bulls are likely to present a solid purchasing opportunity near the $164 level. Conversely, if a break below the $164 support occurs, the price may return to the $156 zone.
The price of ETH is trading at $171.47 at the time of writing.
XRP/USD
After the deviation near the level of $0.3780, the price was adjusted lower against the US dollar. The pair XRP/USD fell below the levels of $0.3700 and $0.3600. Later, the price bounced back and made several attempts to consolidate above the resistance levels of $0.3710 and $0.3740. However, buyers failed, and the price fell below the Fibonacci retracement of 50% of the last wave from a minimum of $0.3255 to a maximum of $0.3780.
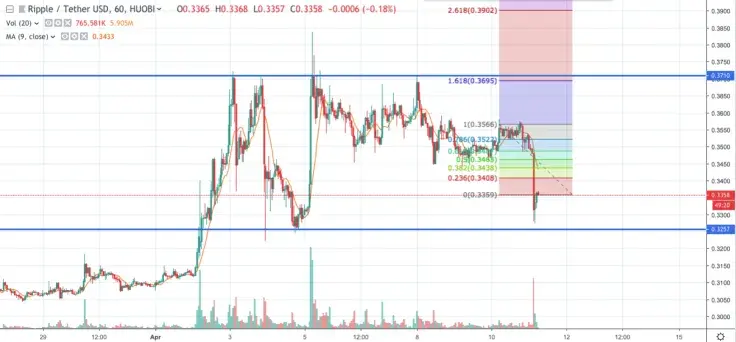
Looking at the chart, it seems that the price is struggling to gain momentum above $0.3600, which can lead to a short-term breakdown. Closing below $0.3480 and $0.3460 is likely to cause a prolonged fall to the support area of $0.3320 or $0.3250 in the upcoming sessions.
The price of XRP is trading at $0.3395 at the time of writing.
 Dan Burgin