

Disclaimer: The opinions expressed by our writers are their own and do not represent the views of U.Today. The financial and market information provided on U.Today is intended for informational purposes only. U.Today is not liable for any financial losses incurred while trading cryptocurrencies. Conduct your own research by contacting financial experts before making any investment decisions. We believe that all content is accurate as of the date of publication, but certain offers mentioned may no longer be available.

No advantage on Solana
After rising from its June lows, Solana is still in a consolidation phase, with neither buyers nor sellers able to gain a clear advantage. The asset is still trading in the vicinity of $74, fluctuating between its short-term moving averages while encountering ongoing resistance above.
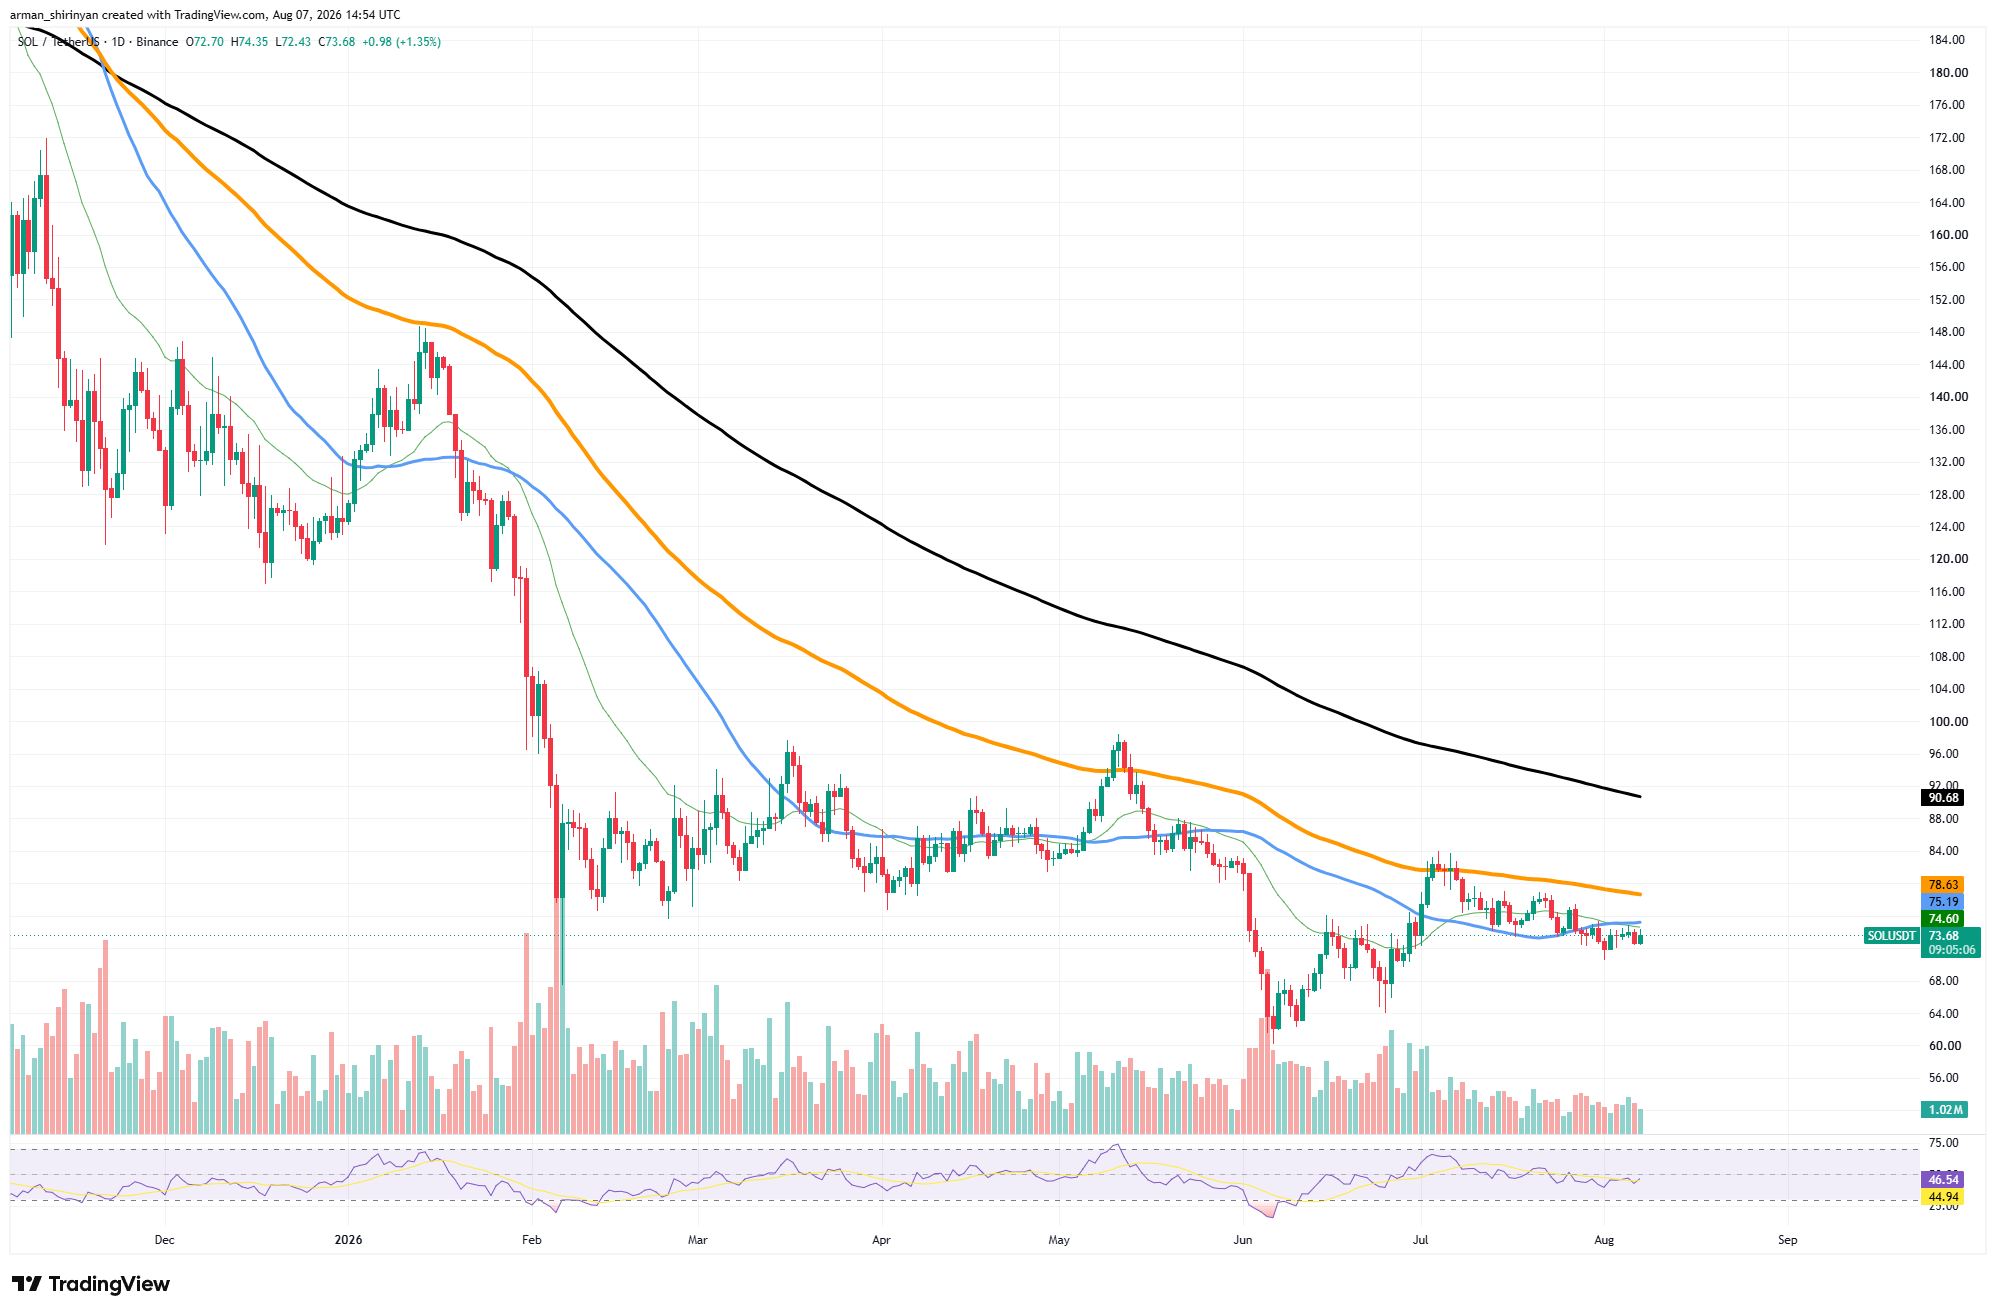
The picture is neutral in theory, but it is fragile. Following weeks of sideways movement, SOL is now trading close to both the 20-day and 50-day moving averages. Rather than the beginning of a significant trend, this usually indicates equilibrium between buyers and sellers. But every attempt at recovery is still capped by the 100-day moving average at $79, and the 200-day moving average is still much higher at $90, indicating that the overall trend is still negative.
According to the most recent candles, buyers are still defending the $72–$73 support range, which keeps the price from moving further toward the June lows. SOL is now confined to a progressively smaller trading range as a result of selling pressure being drawn to every rally toward the $78–$79 region.
Momentum metrics lend credence to this view. The RSI is nearly at neutral levels, at 47, indicating that neither bullish nor bearish momentum is predominant in the market. As traders wait for a catalyst that can break the current impasse, volume has also continued to decline, indicating decreased participation.
Solana needs a clear daily close above the 100-day moving average in order to improve the technical outlook. A move like this could begin to shift medium-term sentiment and bring the psychological $85 level into focus. As of right now, the structure remains one of consolidation within a larger downward trend.
XRP prints decreasing volumes
The most recent rejection near the 20-day and 50-day moving averages has once again shifted momentum in favor of sellers, and XRP is still stuck in a persistent downtrend. The asset has returned to the crucial $1.02–$1.03 support zone after several weeks of range-bound trading, failing to produce the breakout bulls were hoping for.
The 200-day moving average is still trending considerably higher at $1.38, while XRP is currently trading below the 20-, 50-, and 100-day moving averages. This alignment demonstrates that, despite the protracted consolidation that followed June's precipitous decline, the overall trend is still bearish.
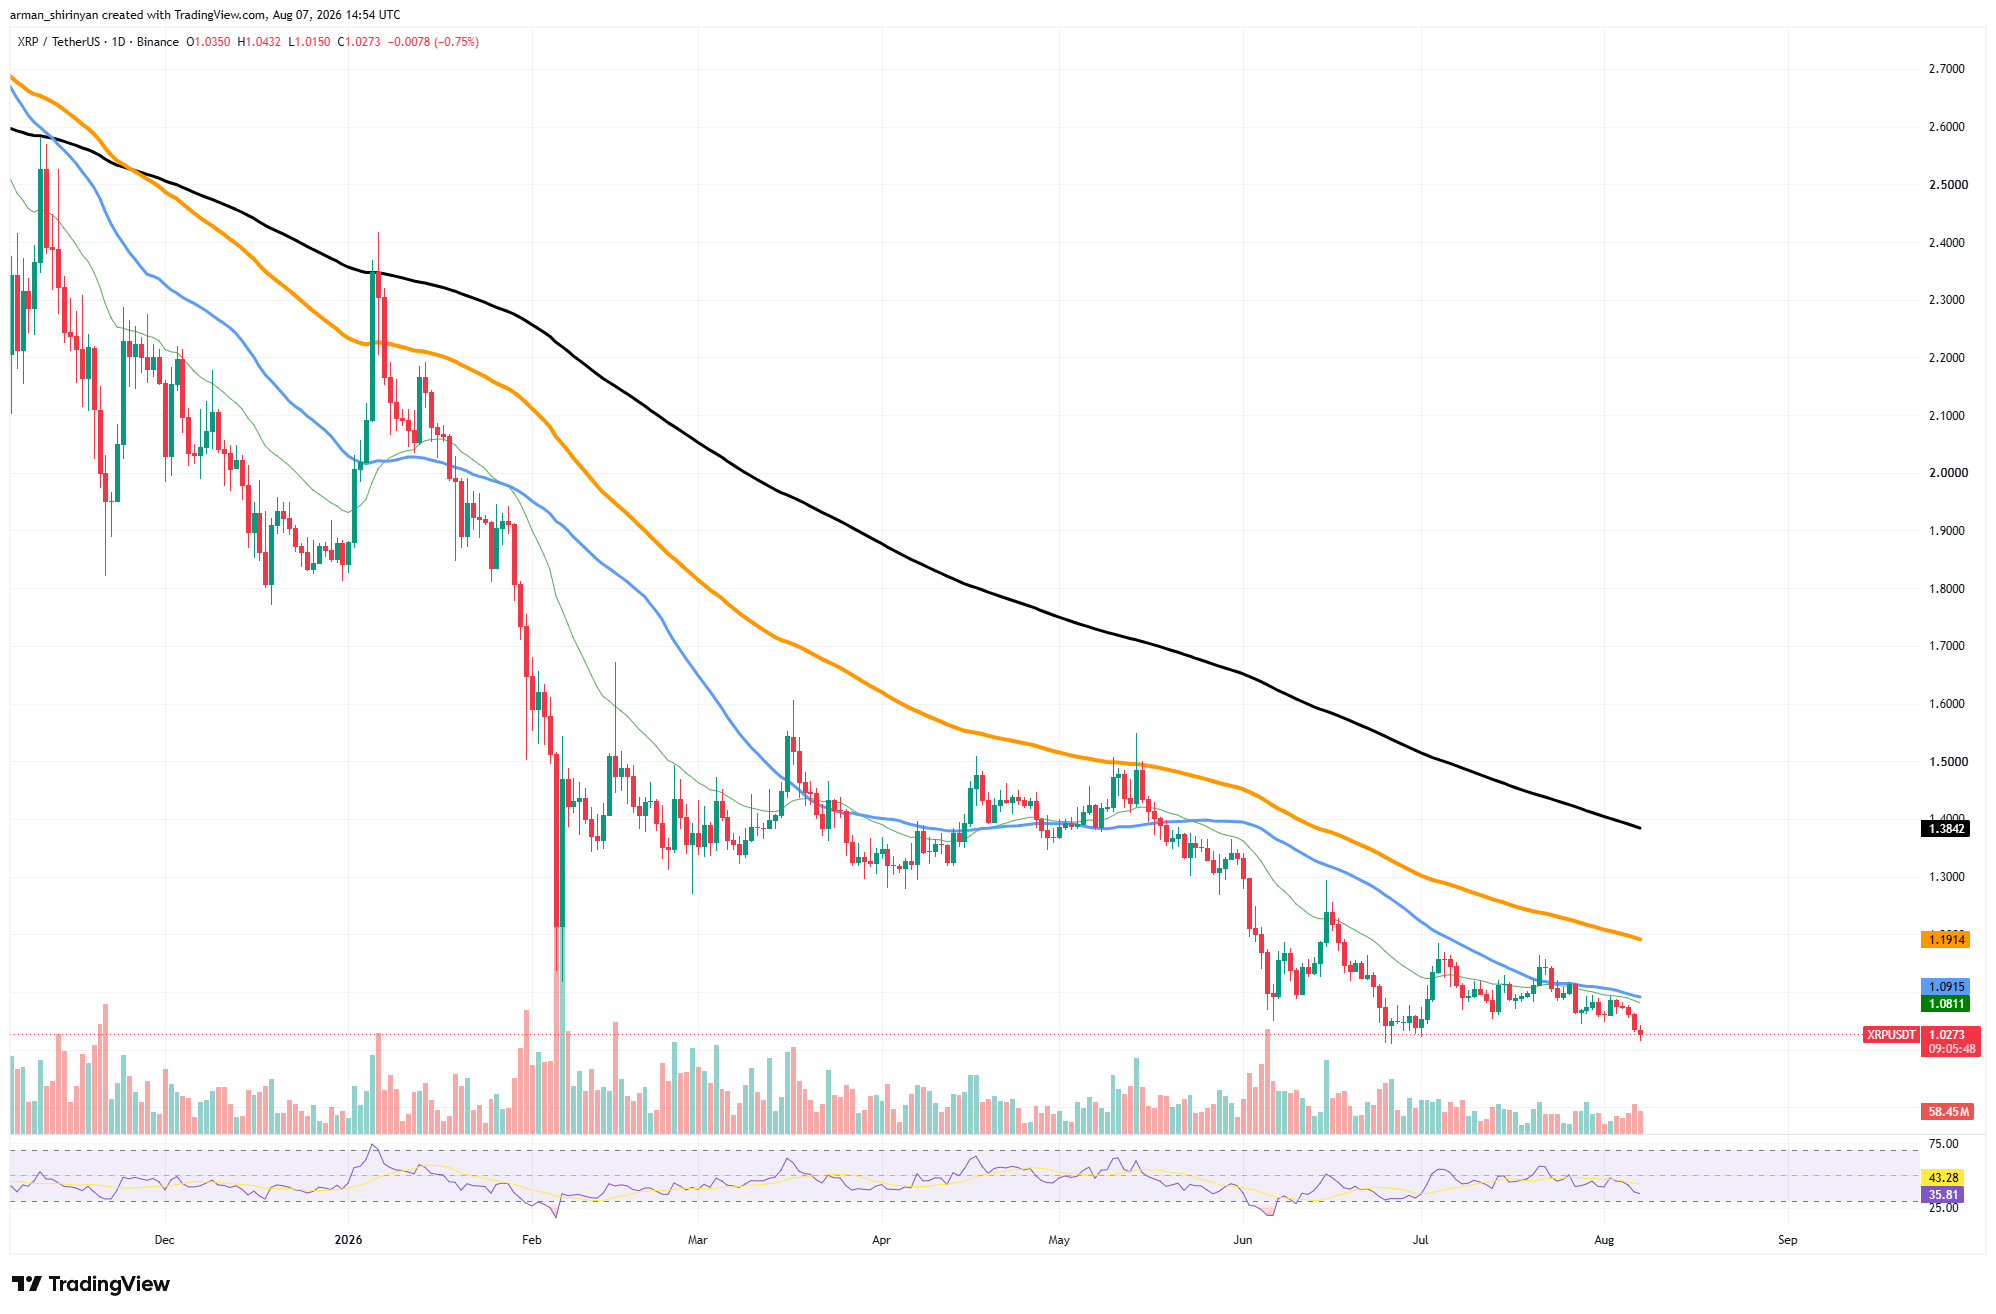
One encouraging sign is that selling pressure has not increased. XRP has been steadily declining on decreasing volume rather than experiencing another impulsive breakdown, indicating that aggressive bears are no longer controlling the market. Nevertheless, buyers have also failed to create significant demand, trapping the asset in a gradual decline.
That balance is reflected in momentum indicators. For the first time in a few weeks, the RSI has dropped to about 36, approaching oversold territory. Oversold conditions alone are rarely sufficient to reverse a trend without confirmation from price action, though this may eventually draw bargain hunters.
The psychological $1.00 level continues to provide immediate support. Another wave of selling toward the June lows would probably result from losing that area. In order to challenge the 50-day average around $1.09, XRP must first recover the 20-day moving average.
Sentiment would only start to turn back in favor of buyers if the price continued to rise above those levels. As of right now, XRP is still trading defensively. The chart still lacks the stronger volume and higher highs required to confirm that a significant recovery has begun, even though the rate of decline has slowed.
Pressure on Shiba Inu is there
Following another rejection below the 50-day moving average, Shiba Inu's recovery has stalled, leaving the meme coin susceptible to fresh selling pressure. The strong breakout that occurred earlier this month gave the impression that buyers were prepared to buck the trend, but it soon faded as SHIB fell back below the crucial resistance level.
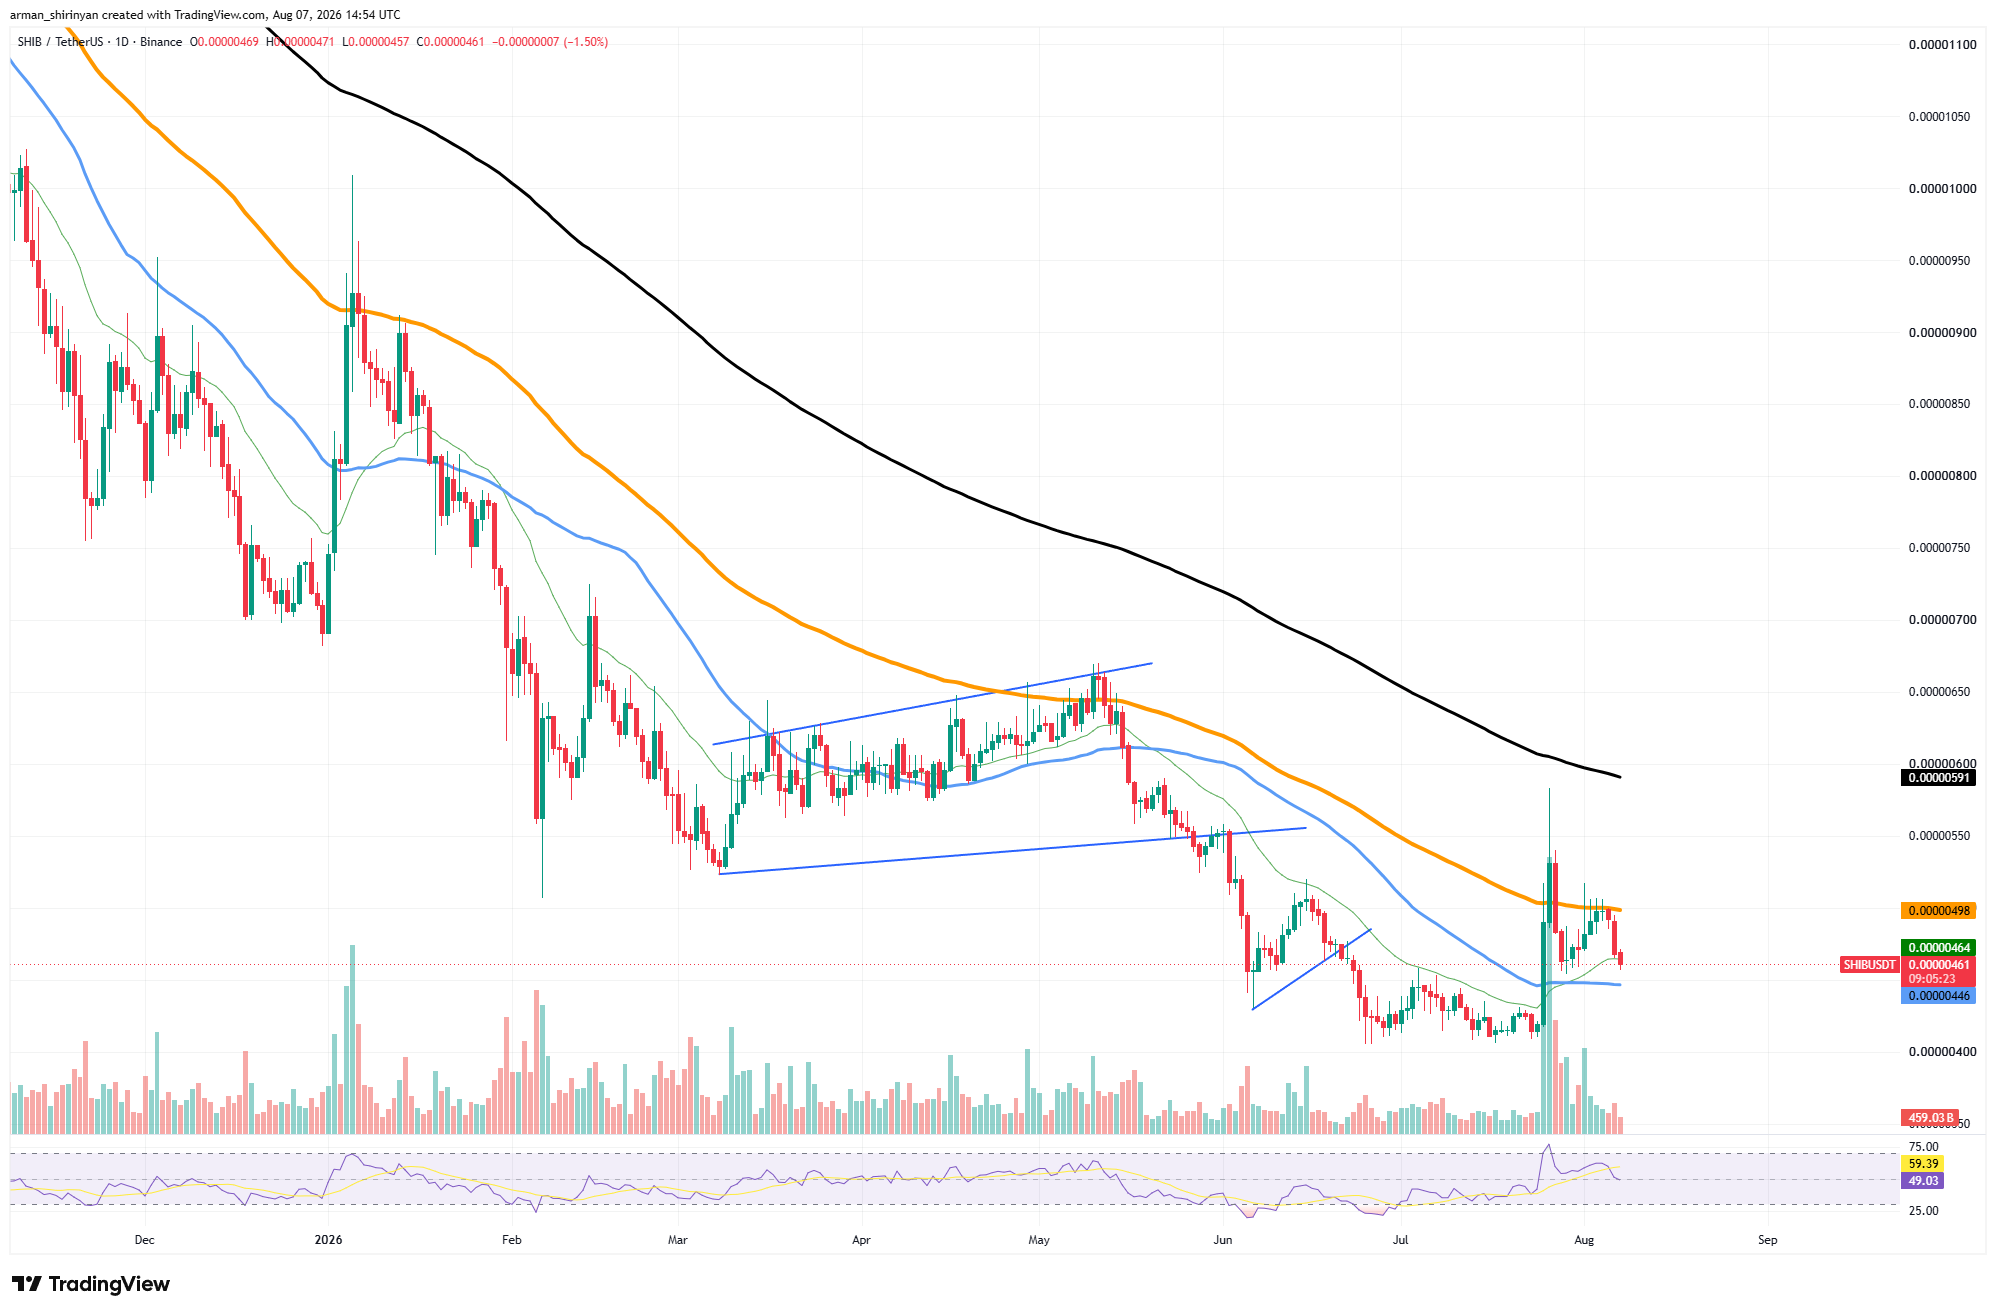
After failing to stay above $0.00000500, the price is currently trading around $0.00000464. Because it aligns with the declining 50-day moving average, that region has come to define resistance for the current market structure. Every attempt to gain a foothold above that level has drawn sellers, which has prevented the recovery from picking up steam.
Technically speaking, SHIB is still below the 50-, 100-, and 200-day moving averages, maintaining the longer-term trend's strong bearishness. The 20-day moving average still offers nearby support, but after the most recent decline, its upward slope has started to level out, suggesting that bullish momentum is waning.
During the breakout, the RSI briefly entered bullish territory, but it has since cooled significantly. After the initial buying surge subsided, the indicator now sits slightly below 50, indicating neutral momentum. The loss of momentum could lead to another test of lower support levels if buyers do not swiftly regain control.
A similar story is told by volume. Participation was remarkably high during the breakout, but turnover has been steadily declining in subsequent sessions. This implies that following the unsuccessful attempt to overcome resistance, traders are growing more cautious. The first support remains near $0.00000445, where the 20-day moving average and prior consolidation converge.
SHIB might return to the July lows at $0.00000410 if that level fails. On the other hand, reclaiming the $0.00000500 area would render the most recent rejection void and reopen the door to a more extensive recovery.
SHIB is currently in a "wait and see" phase. Although there was a brief improvement in sentiment due to the explosive rally, the broader bearish trend will continue to dominate the chart until the token closes firmly above its 50-day moving average.
Cardano keeps outperforming
After extending its recovery toward the crucial $0.20 resistance area, Cardano is still outperforming many large-cap altcoins. Despite a slight decline in today's session, the overall technical picture is still positive following the recent breakout, which was bolstered by significantly higher trading volume.
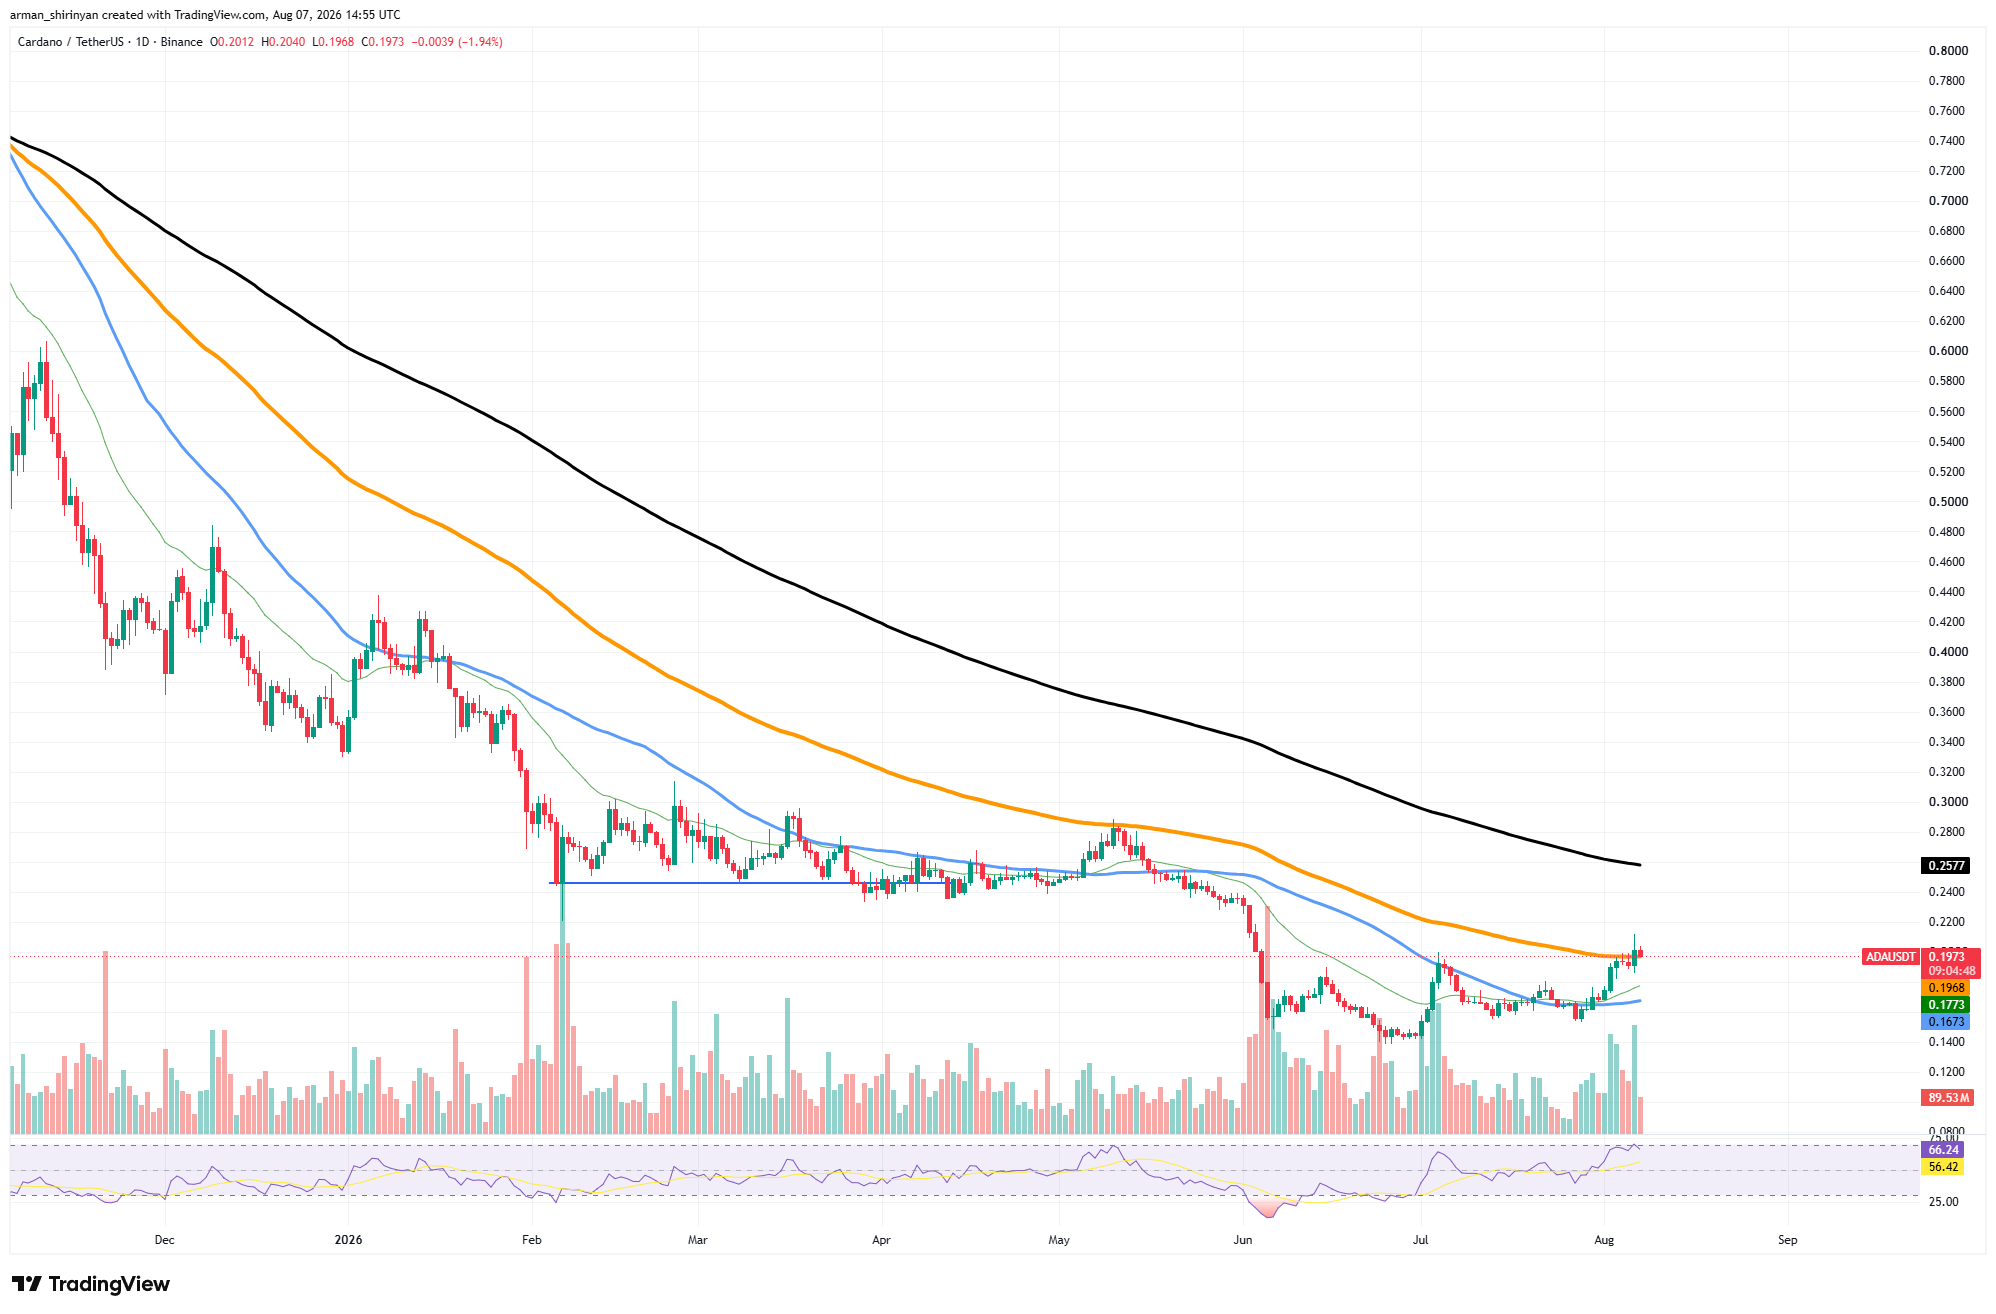
Despite facing selling pressure near the 100-day moving average at $0.20, ADA has successfully reclaimed both the 20-day and 50-day moving averages and is currently holding above them. Compared to the structure observed in June and early July, when the asset continuously traded below all major trend indicators, this represents a significant improvement.
This pause looks more like profit-taking than a reversal. Over the past few weeks, buyers have maintained a series of higher lows, indicating that demand continues to withstand selling pressure following each advance. The recovery structure is intact as long as ADA stays above the 50-day moving average around $0.18.
Though it has somewhat cooled from recent highs, momentum is still favorable. The RSI is currently at 68, slightly below overbought territory. This suggests that bullish momentum is still present but has not reached the extreme that would normally precede a more significant correction.
The psychological $0.20 level and the 100-day moving average remain the current obstacles. The next significant technical target, the 200-day moving average near $0.26, would probably come into focus if there were a strong breakout above that resistance.
As of right now, Cardano continues to have one of the most robust recovery structures among major altcoins. As long as higher lows continue to form and the price stays above the reclaimed short-term moving averages, buyers maintain control even as resistance continues to slow the advance.
 U.Today Editorial Team
 Dan Burgin
