Disclaimer: The opinions expressed by our writers are their own and do not represent the views of U.Today. The financial and market information provided on U.Today is intended for informational purposes only. U.Today is not liable for any financial losses incurred while trading cryptocurrencies. Conduct your own research by contacting financial experts before making any investment decisions. We believe that all content is accurate as of the date of publication, but certain offers mentioned may no longer be available.
One of the market's weakest large-cap stocks is still Shiba Inu. SHIB attempted a brief recovery after breaking out of a multi-month rising channel earlier this month, but it was unable to maintain momentum. The token is slipping below a small ascending support line that developed following the June capitulation event, according to the most recent chart, suggesting that sellers are still in complete control.
The price is still below all significant moving averages and is currently trading close to $0.0000045. While the 100-day and 200-day averages are even higher, the 50-day moving average at $0.0000050 continues to serve as immediate resistance. The overall trend is still clearly bearish, as this alignment demonstrates.
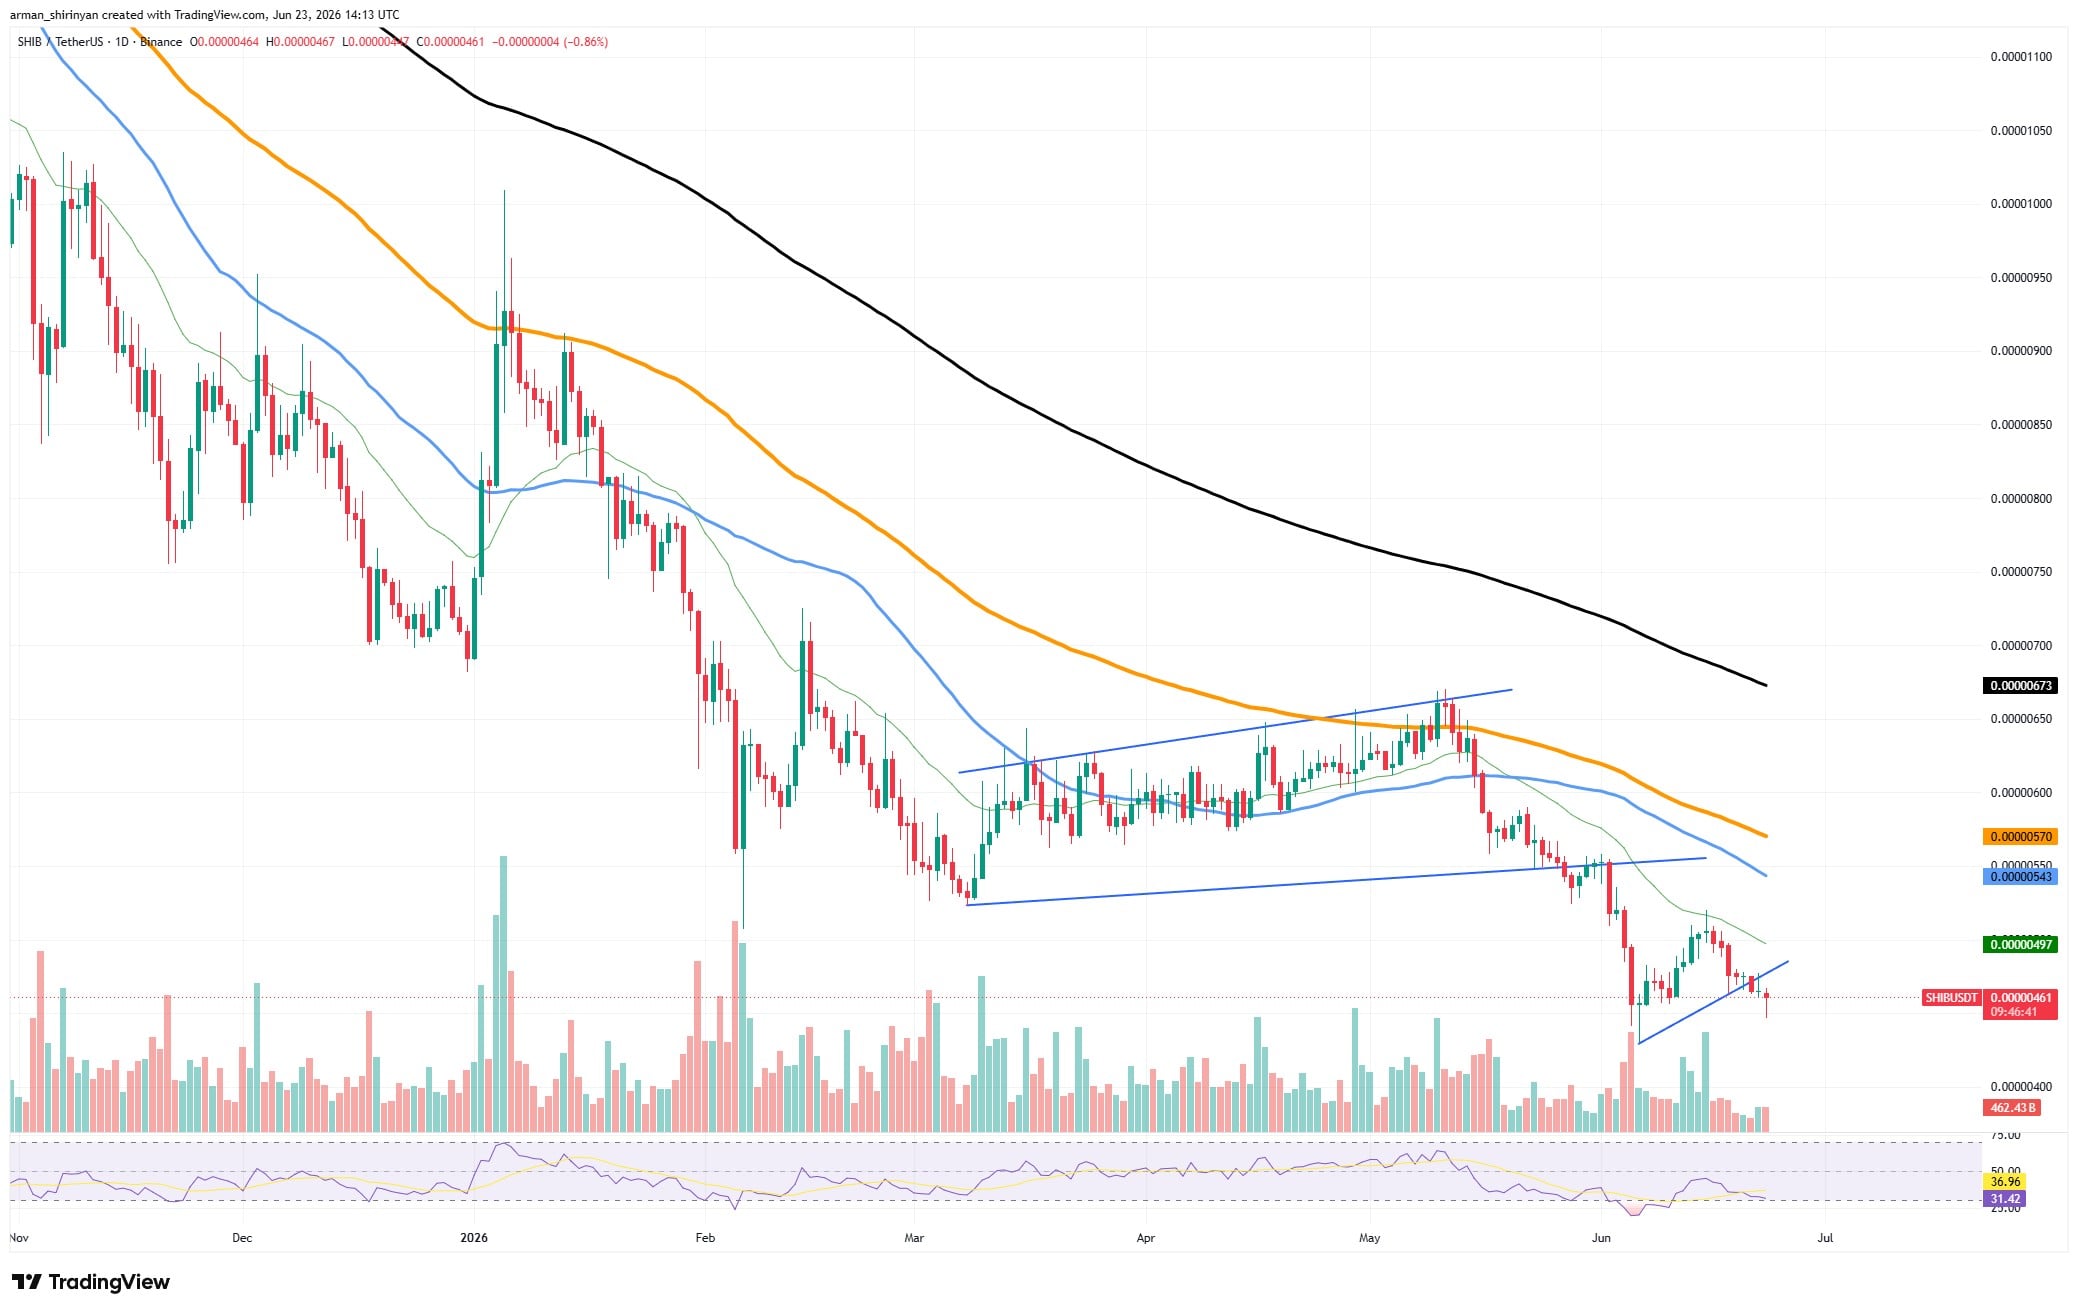
Even though the Relative Strength Index is close to oversold territory, this does not necessarily indicate a reversal. In actuality, protracted bear markets frequently result in prolonged RSI suppression.
Additionally, volume has decreased during attempts at recovery, indicating a lack of buyer conviction. About $0.0000044 is still the main support area. If that level is lost, there may be additional pressure to sell. Reclaiming $0.0000050 is the bare minimum needed for bulls to start talking about a more significant recovery.
XRP isn't finding the recovery ground
The state of XRP is not much better. After losing the crucial $1.28 support zone that had held for months, the asset is still trading around $1.10. The breakdown led to a precipitous decline that rendered the prior consolidation structure essentially invalid.
XRP has made multiple attempts at a comeback since discovering temporary support around $1.05. Before reaching the 50-day moving average, each rally has, nevertheless, encountered selling pressure.

The most recent rejection, which was close to $1.18, indicates that buyers are still having difficulty taking back control. Technically speaking, XRP is still below its 50-, 100-, and 200-day moving averages, with the 100-day average at $1. 28 currently serving as significant resistance.
Weak momentum is evident in the RSI, which has recovered from oversold levels but is still below neutral territory. Whether XRP can remain above the psychological $1.00-$1.05 support zone is the immediate concern. There would probably be another round of selling if it broke below that area. Bulls must recover $1.20 on the upside before talking about a more significant trend reversal is feasible. As of right now, XRP is still in a relief-bounce stage of a larger decline.
Bitcoin hits the critical support
After losing the crucial $65,000 support level and failing to regain it during the most recent relief bounce, Bitcoin is under a lot of pressure. The uptrend that propelled Bitcoin toward the $82,000 area earlier this year is clearly broken down in the chart. Sellers have maintained complete control since then.
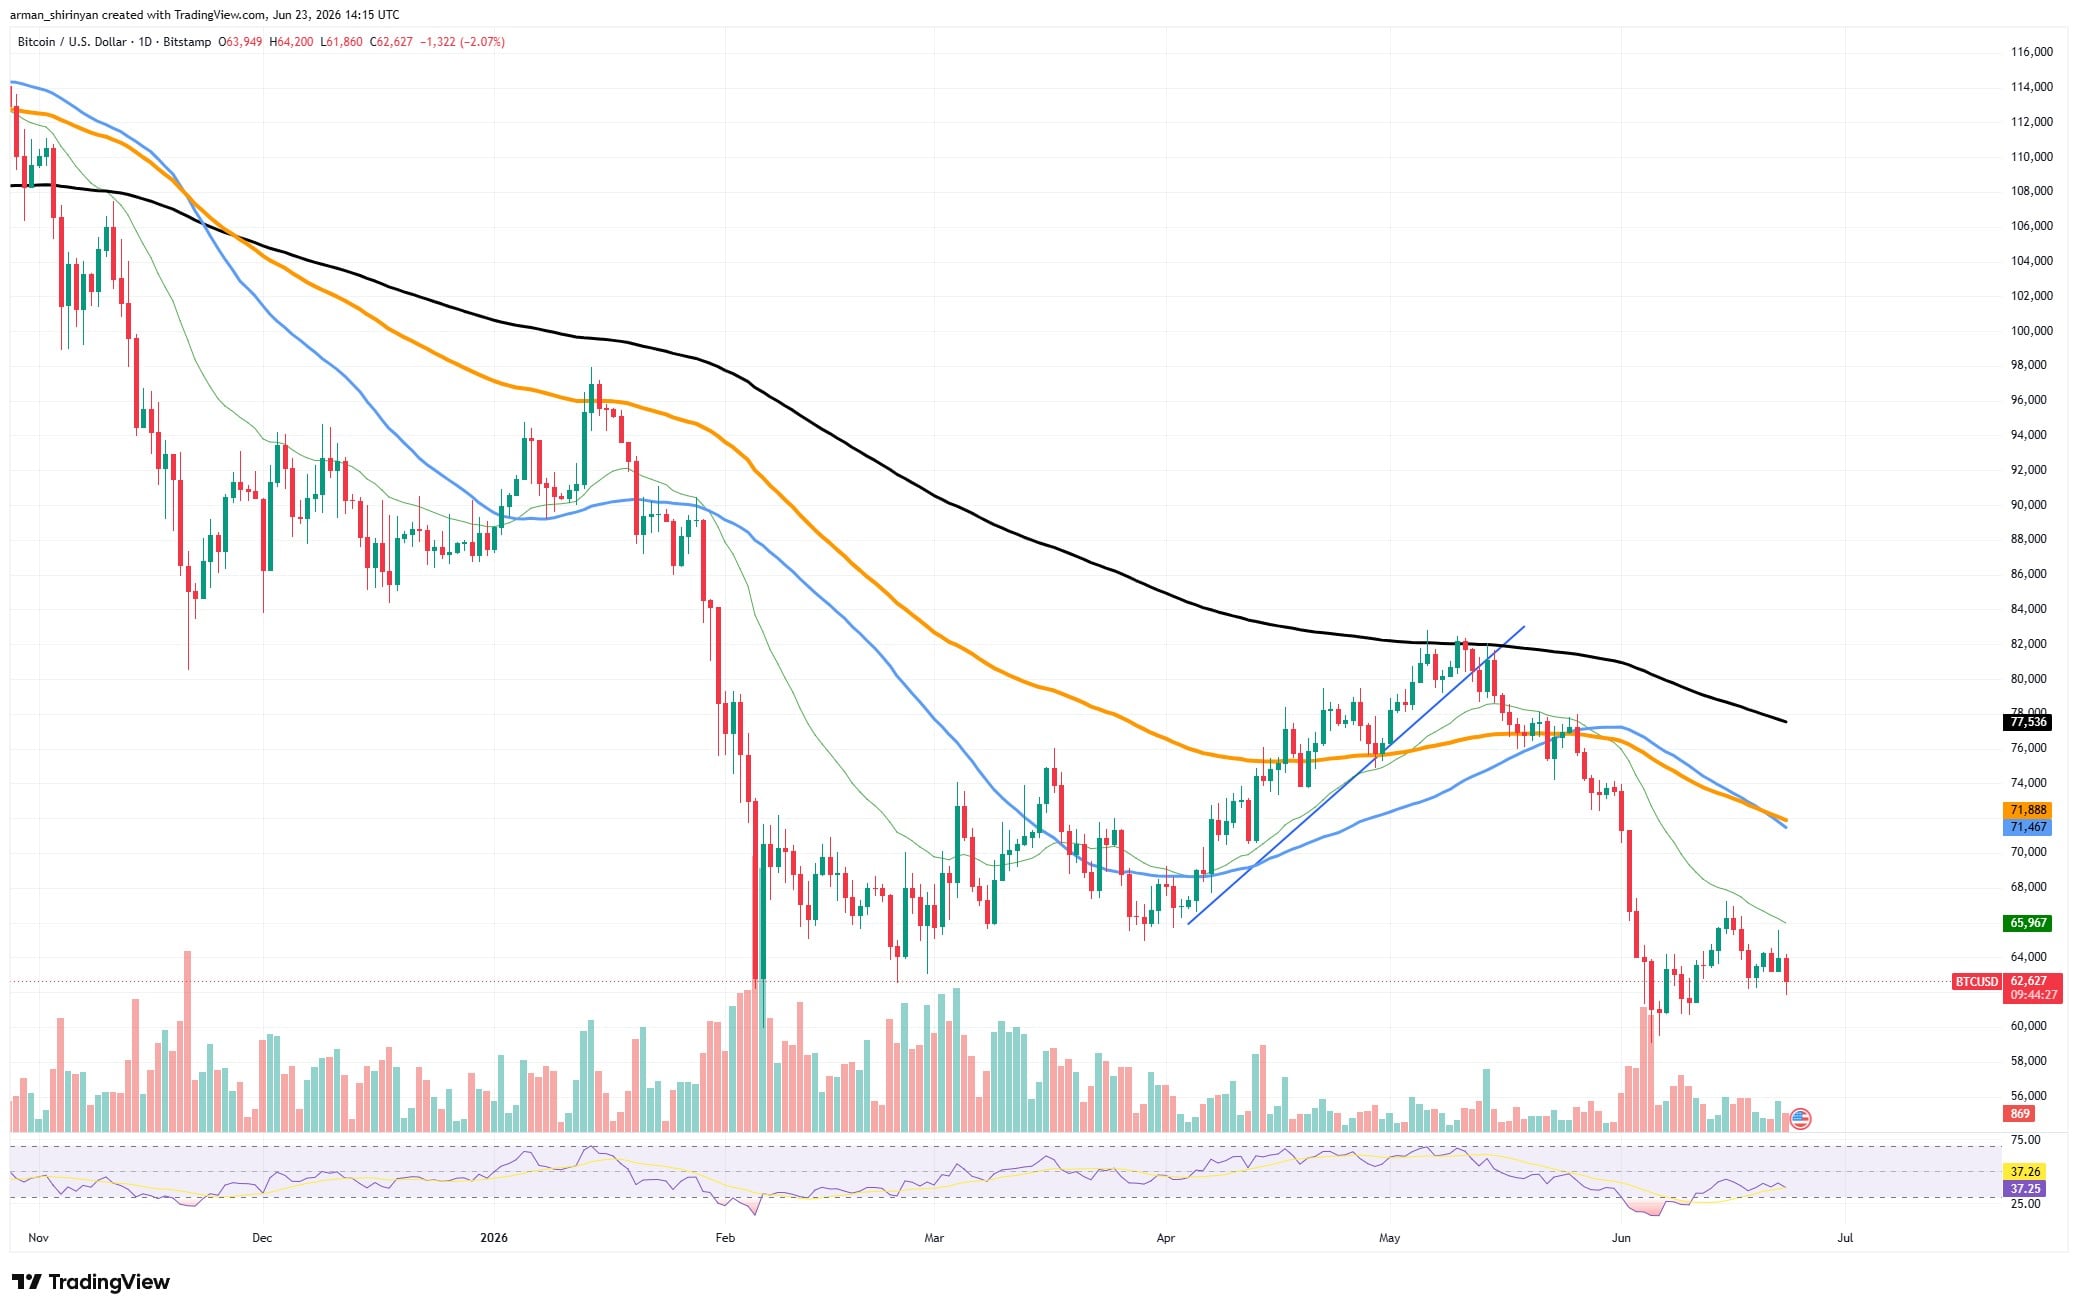
The rejection from the 50-day moving average after the June crash is the most worrying development. Bitcoin is currently trading at about $62,000, perilously close to the recent local lows, as every attempt to recover has been met with selling pressure. Volume increased during the breakdown, indicating that there was a real change in market sentiment rather than just a brief shakeout.
Technically speaking, Bitcoin is still below every significant moving average. Bulls would need to retake the 100-day and 200-day averages around $72,000 and $77,000 before any talk of a trend reversal is feasible.
The RSI is still weak overall, but it has somewhat recovered from oversold conditions. The possibility of another move toward the $60,000 psychological support is still high unless Bitcoin can swiftly recover the $65,000-$66,000 range. A much deeper correction might result from a break below that level.
Will HYPE find its footing?
Following one of the biggest cryptocurrency rallies of the year, Hyperliquid is going through its first significant stress test. HYPE has made a significant correction and is currently trading close to $63 after hitting highs above $75. The chart is still much stronger than the majority of altcoins despite the recent decline.
HYPE continues to trade above its 50-, 100-, and 200-day moving averages, in contrast to Bitcoin. Even though momentum has obviously decreased over the last two weeks, the overall uptrend is still in place. Profit-taking seems to be the main cause of the current decline rather than structural weakness.
A correction was unavoidable after gaining several hundred percent in a comparatively short amount of time. A crucial support zone is currently emerging around the 50-day moving average at $64.
After spending weeks close to overbought levels, momentum indicators are rapidly cooling, with the RSI returning to neutral territory. If customers eventually come back, this reset might actually be beneficial. For the time being, HYPE maintains a bullish long-term trend despite its continuous correction, while Bitcoin is still stuck in a bearish structure. Though it is still susceptible to broader market weakness if Bitcoin's decline picks up speed, HYPE continues to show significantly stronger relative strength among the two assets.
 U.Today Editorial Team
 Dan Burgin