Disclaimer: The opinions expressed by our writers are their own and do not represent the views of U.Today. The financial and market information provided on U.Today is intended for informational purposes only. U.Today is not liable for any financial losses incurred while trading cryptocurrencies. Conduct your own research by contacting financial experts before making any investment decisions. We believe that all content is accurate as of the date of publication, but certain offers mentioned may no longer be available.
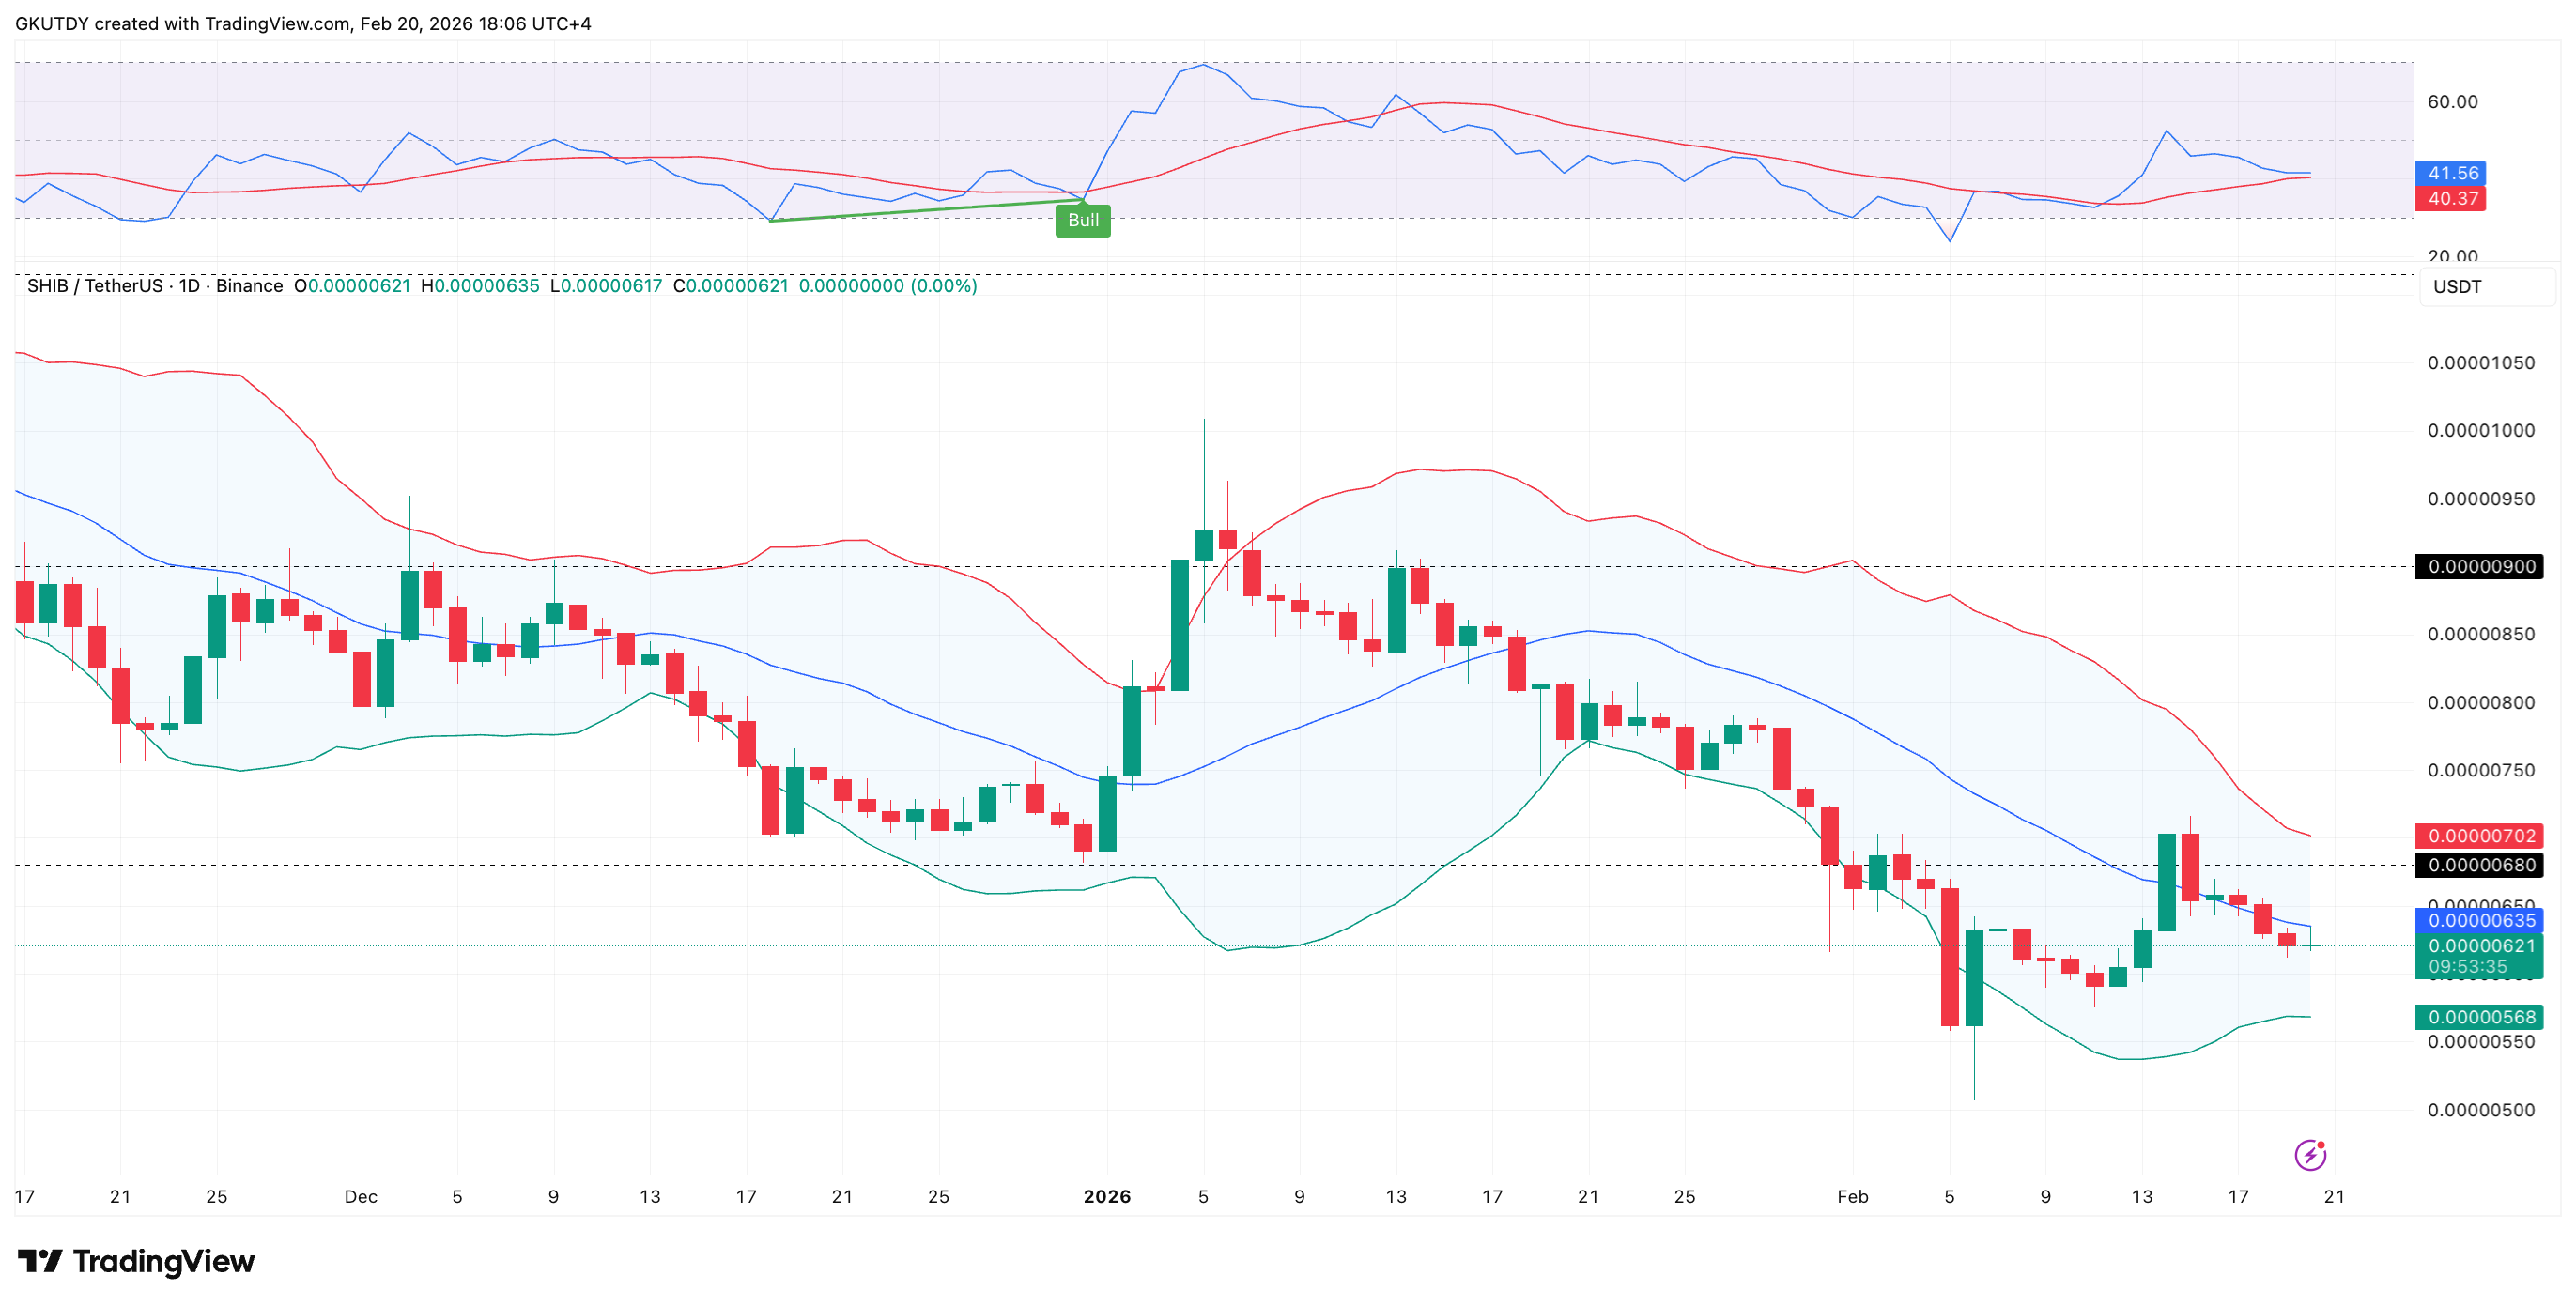
Shiba Inu (SHIB) enters the weekend within striking distance of a key Bollinger Bands level, with the price of the coin now sitting about 2.65% below the midline of it midband, represented by the 20-day moving average — a threshold often associated with a transition from corrective structure to early recovery.
On the daily SHIB/USDT chart by TradingView, the coin is changing hands near $0.00000626, while the 20-day simple moving average, which forms the basis of the Bollinger Bands, stands near $0.00000635. A confirmed close above that zone would position SHIB back inside the upper half of the bands — the one the coin lost this week after a 3.23% sell-off.
Identifying SHIB’s recovery targets and downside risks
Since early January, SHIB has trended lower from the $0.000009 region, printing a sequence of lower highs and lower lows. The lower Bollinger Band recently compressed near $0.0000056, where buyers stepped in, producing a bounce that briefly pushed the price toward $0.000007. That rebound stalled, but the token has not revisited its February low, suggesting supply may be thinning at the margin.
Historically, such compression phases precede directional moves, though not always upward. A daily close above $0.00000635 would open the path toward the upper band near $0.000007, which now aligns with visible horizontal resistance.
February has historically produced mixed results for SHIB, with prior years showing both double-digit gains and drawdowns of the same scale. Current monthly performance remains negative too.
For now, a decisive reclaiming of the midband would mark the first improvement since January. Failure to hold above $0.000006 would likely return focus to the $0.0000056 support area, which is 10% below the current price point.
The 2% gap is small in absolute terms, but in the current market environment for the Shiba Inu coin, it defines the difference between stabilization and continuation.
 Vladislav Sopov
 Dan Burgin