Disclaimer: The opinions expressed by our writers are their own and do not represent the views of U.Today. The financial and market information provided on U.Today is intended for informational purposes only. U.Today is not liable for any financial losses incurred while trading cryptocurrencies. Conduct your own research by contacting financial experts before making any investment decisions. We believe that all content is accurate as of the date of publication, but certain offers mentioned may no longer be available.
The price of the top 10 coins are rising today, according to CoinStats.
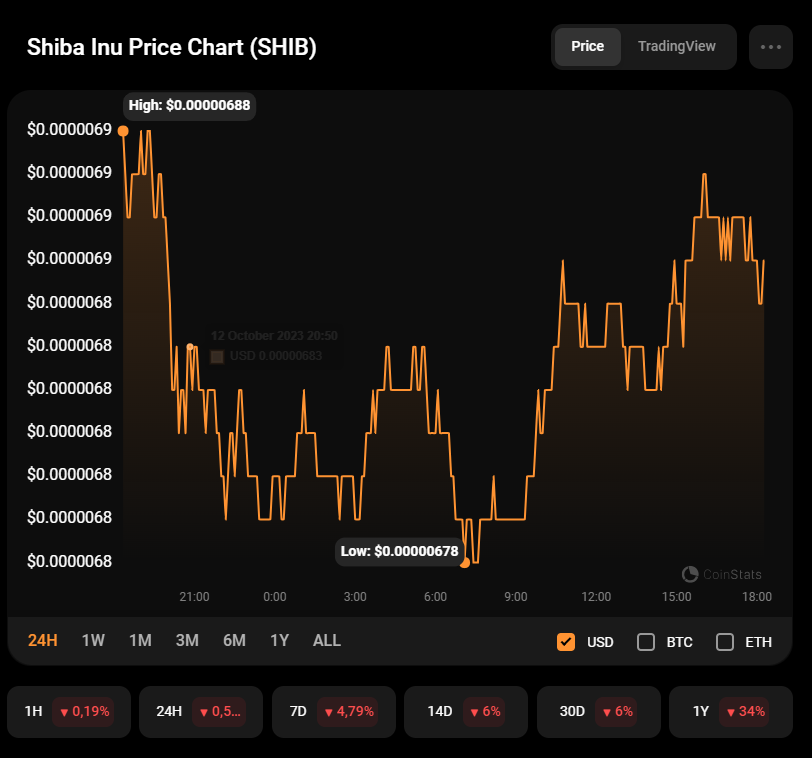
SHIB/USD
The rate of SHIB has not followed the bounce back of other coins, going down by 0.45%.
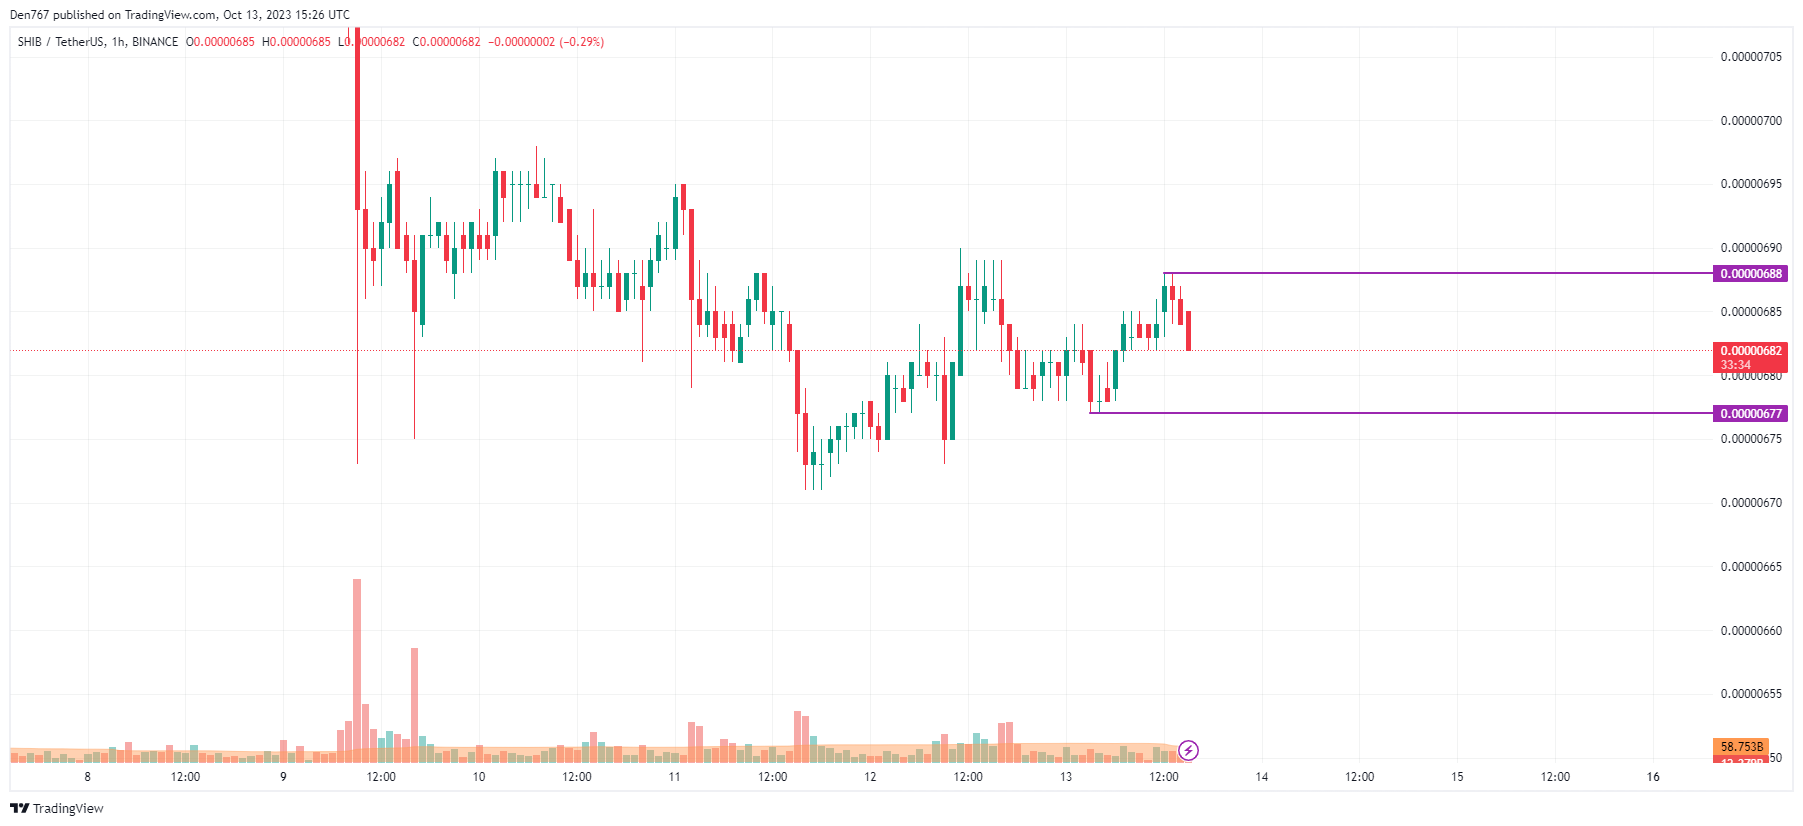
On the hourly chart, the price of SHIB is falling after a test of the resistance of $0.00000688. If the decline continues, one can expect a test of the support level of $0.00000677 soon.
On the bigger time frame, the picture is also more bearish than bullish. The rate is located closer to the support, which means that sellers are not going to give up so easily.

If the bar closes near the $0.00000675 mark, the accumulated energy might be enough for a channel breakout.
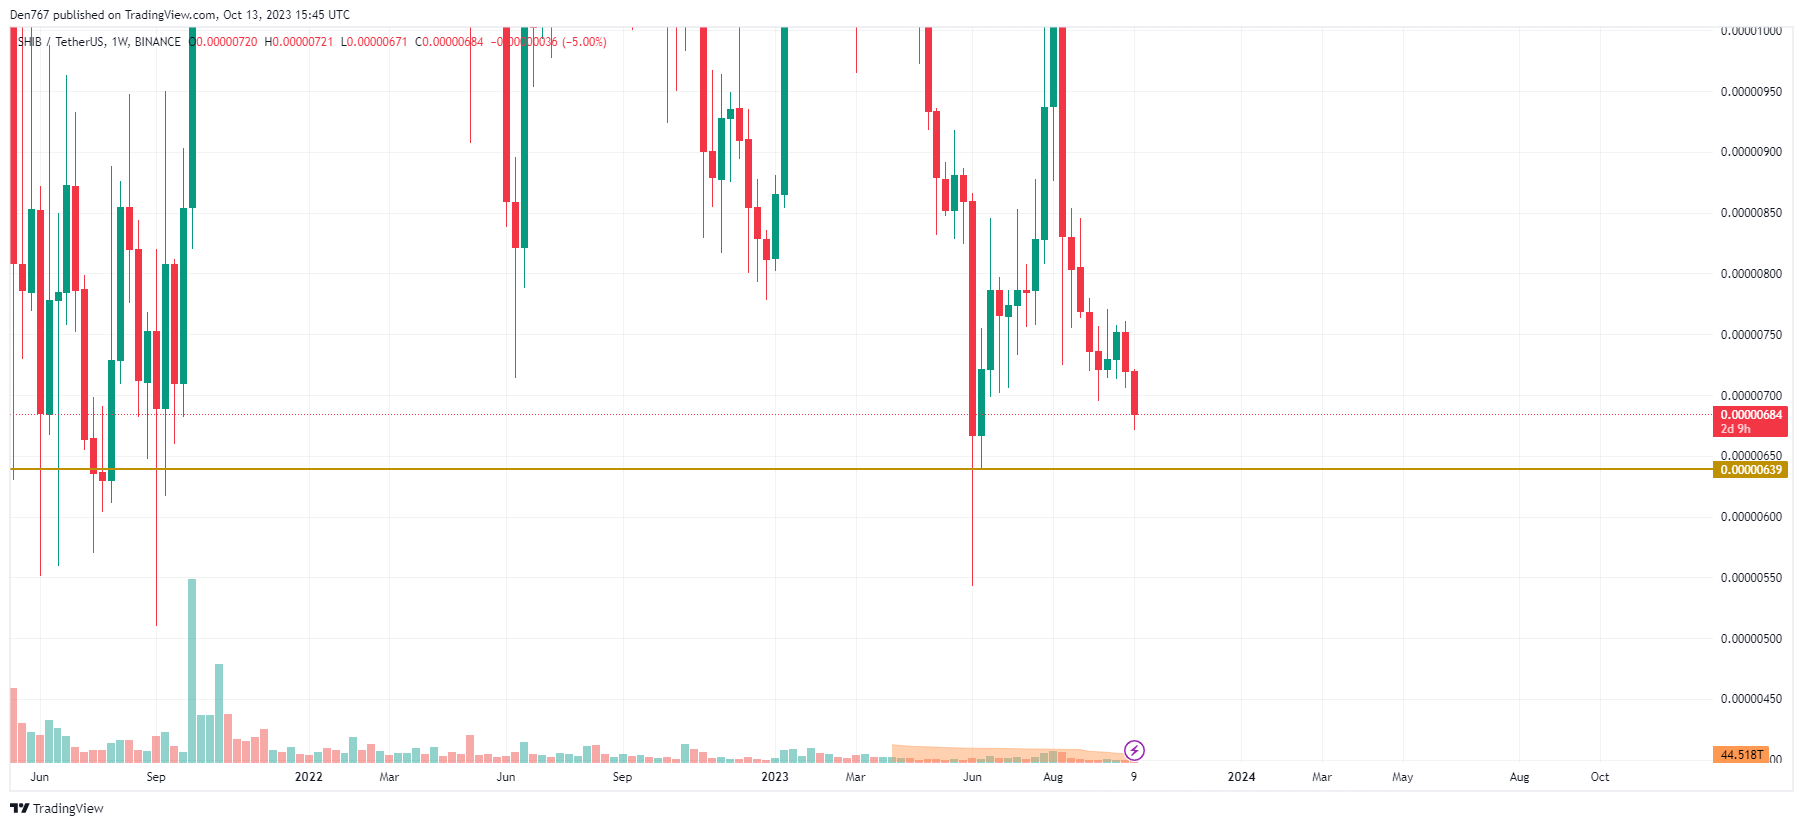
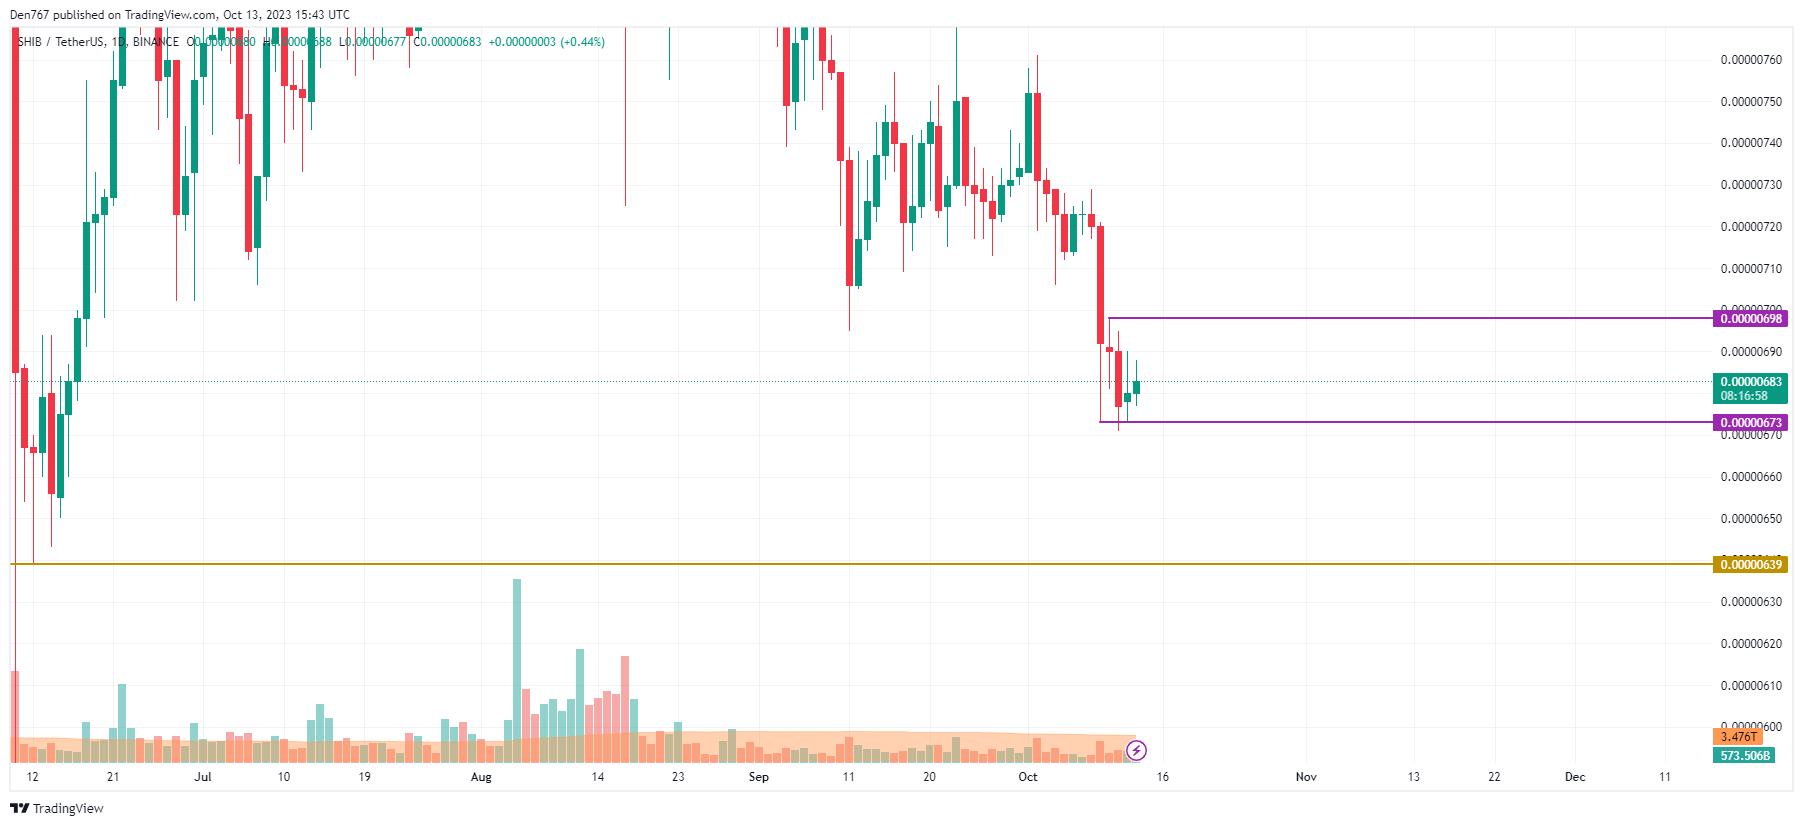
From the midterm point of view, the price is on its way to testing the level of $0.00000639. If the candle closes below the vital zone of $0.000007, there is a high possibility of seeing a drop to the support by the end of the month.
SHIB is trading at $0.00000683 at press time.
 Dan Burgin
 U.Today Editorial Team