Disclaimer: The opinions expressed by our writers are their own and do not represent the views of U.Today. The financial and market information provided on U.Today is intended for informational purposes only. U.Today is not liable for any financial losses incurred while trading cryptocurrencies. Conduct your own research by contacting financial experts before making any investment decisions. We believe that all content is accurate as of the date of publication, but certain offers mentioned may no longer be available.
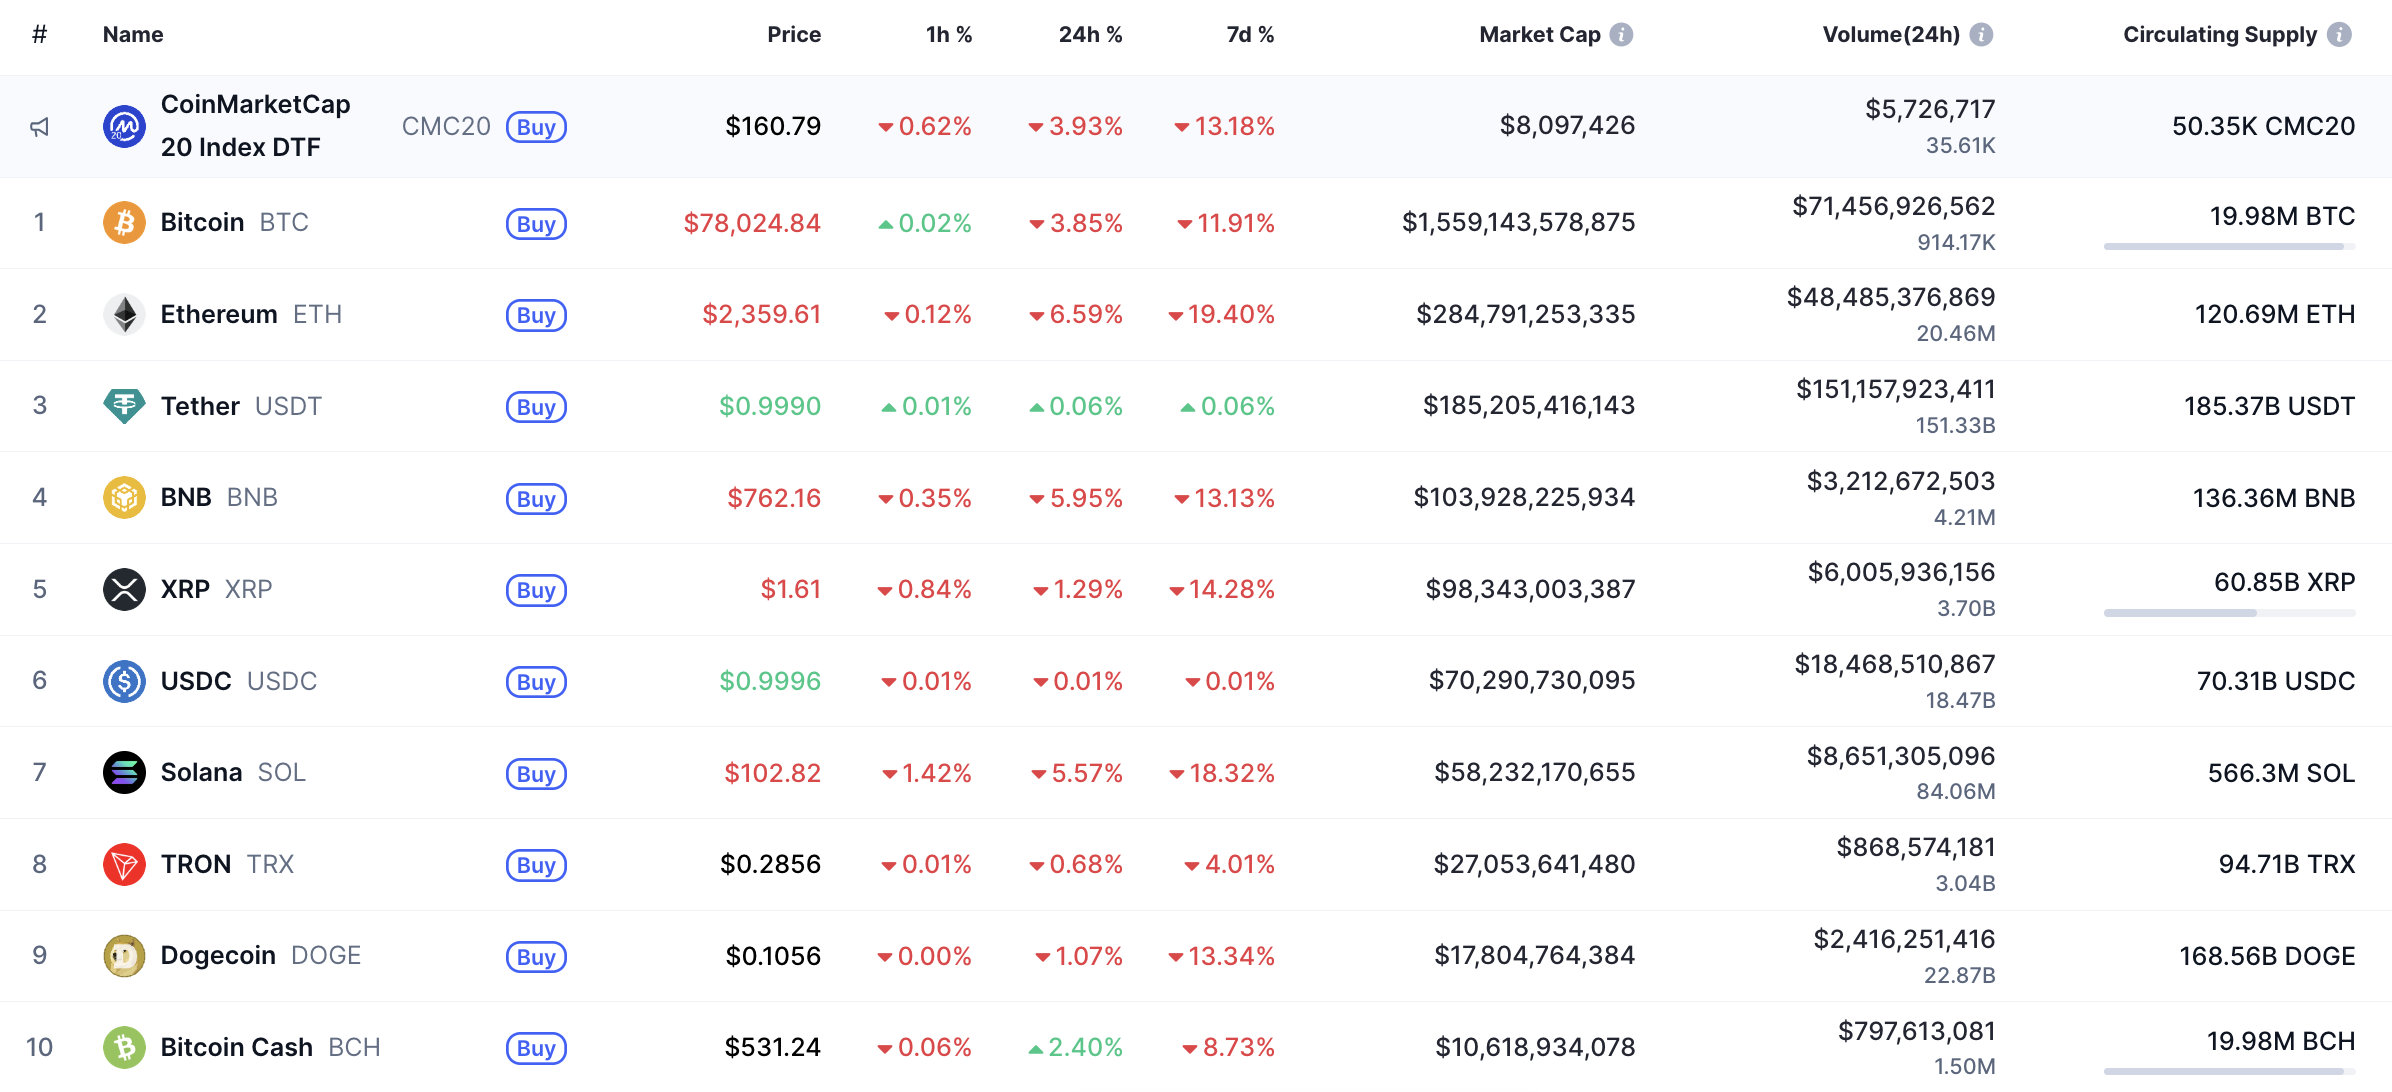
The end of the week is bearish for most of the coins, according to CoinMarketCap.
SHIB/USD
The price of SHIB has dropped by 0.17% over the last 24 hours.
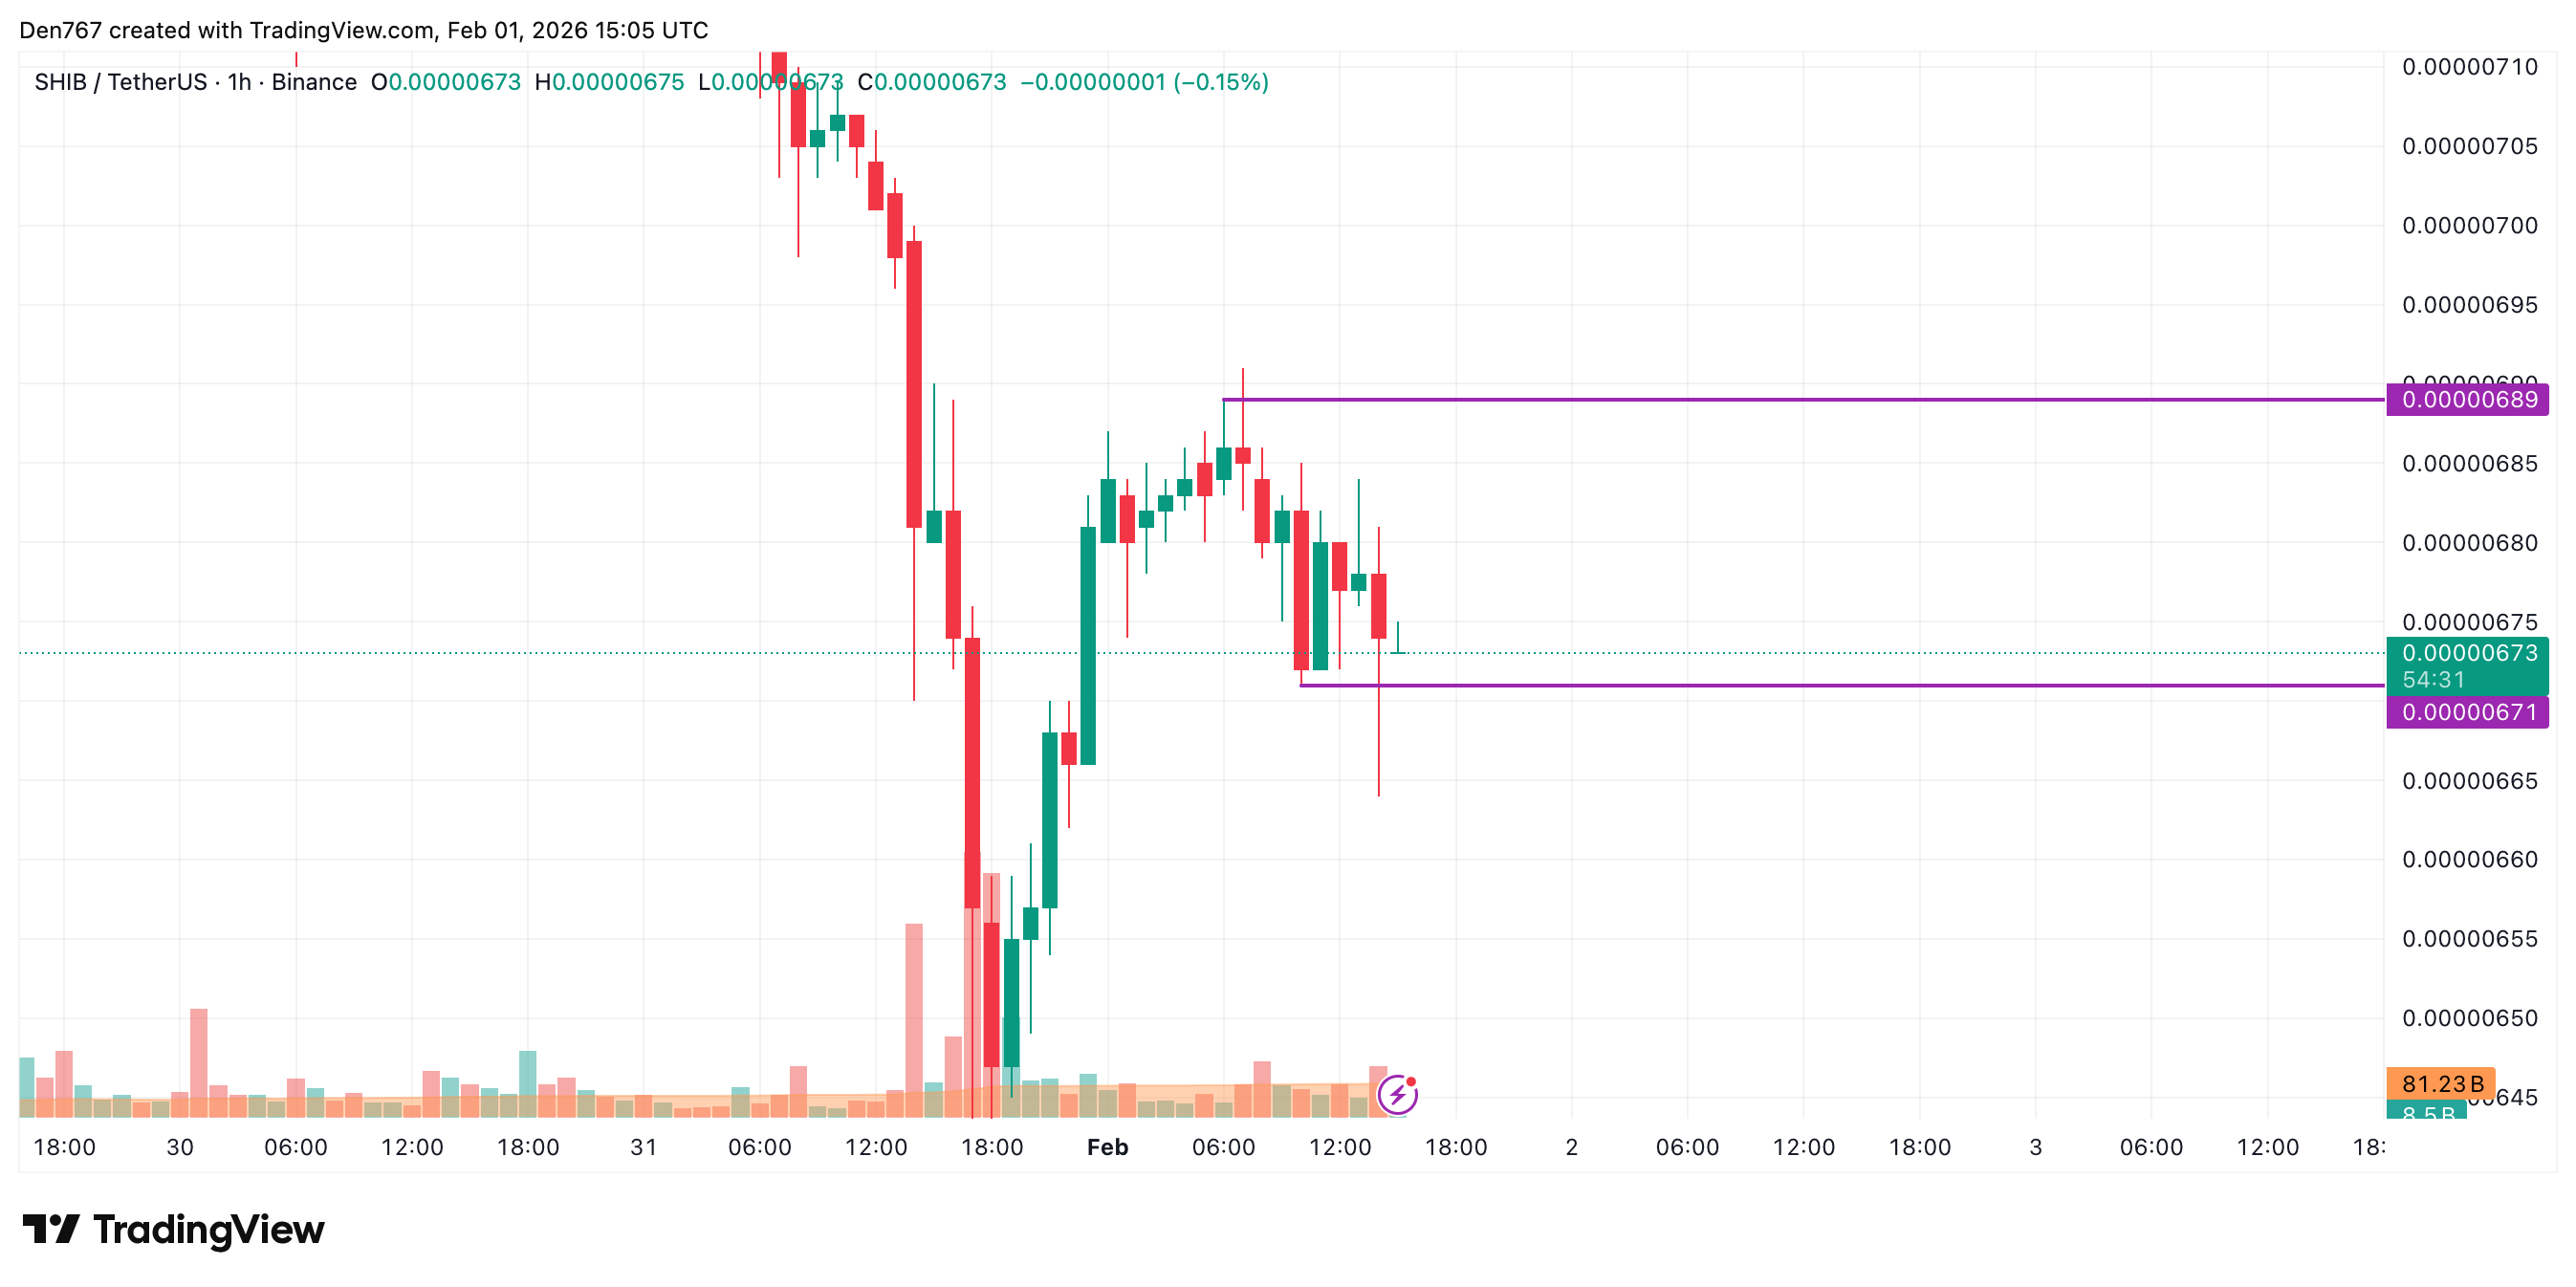
On the hourly chart, the rate of SHIB keeps going down after a false breakout of the local support at $0.00000671. If the daily bar closes below that mark, there is a chance to see a test of the $0.00000650 range shortly.
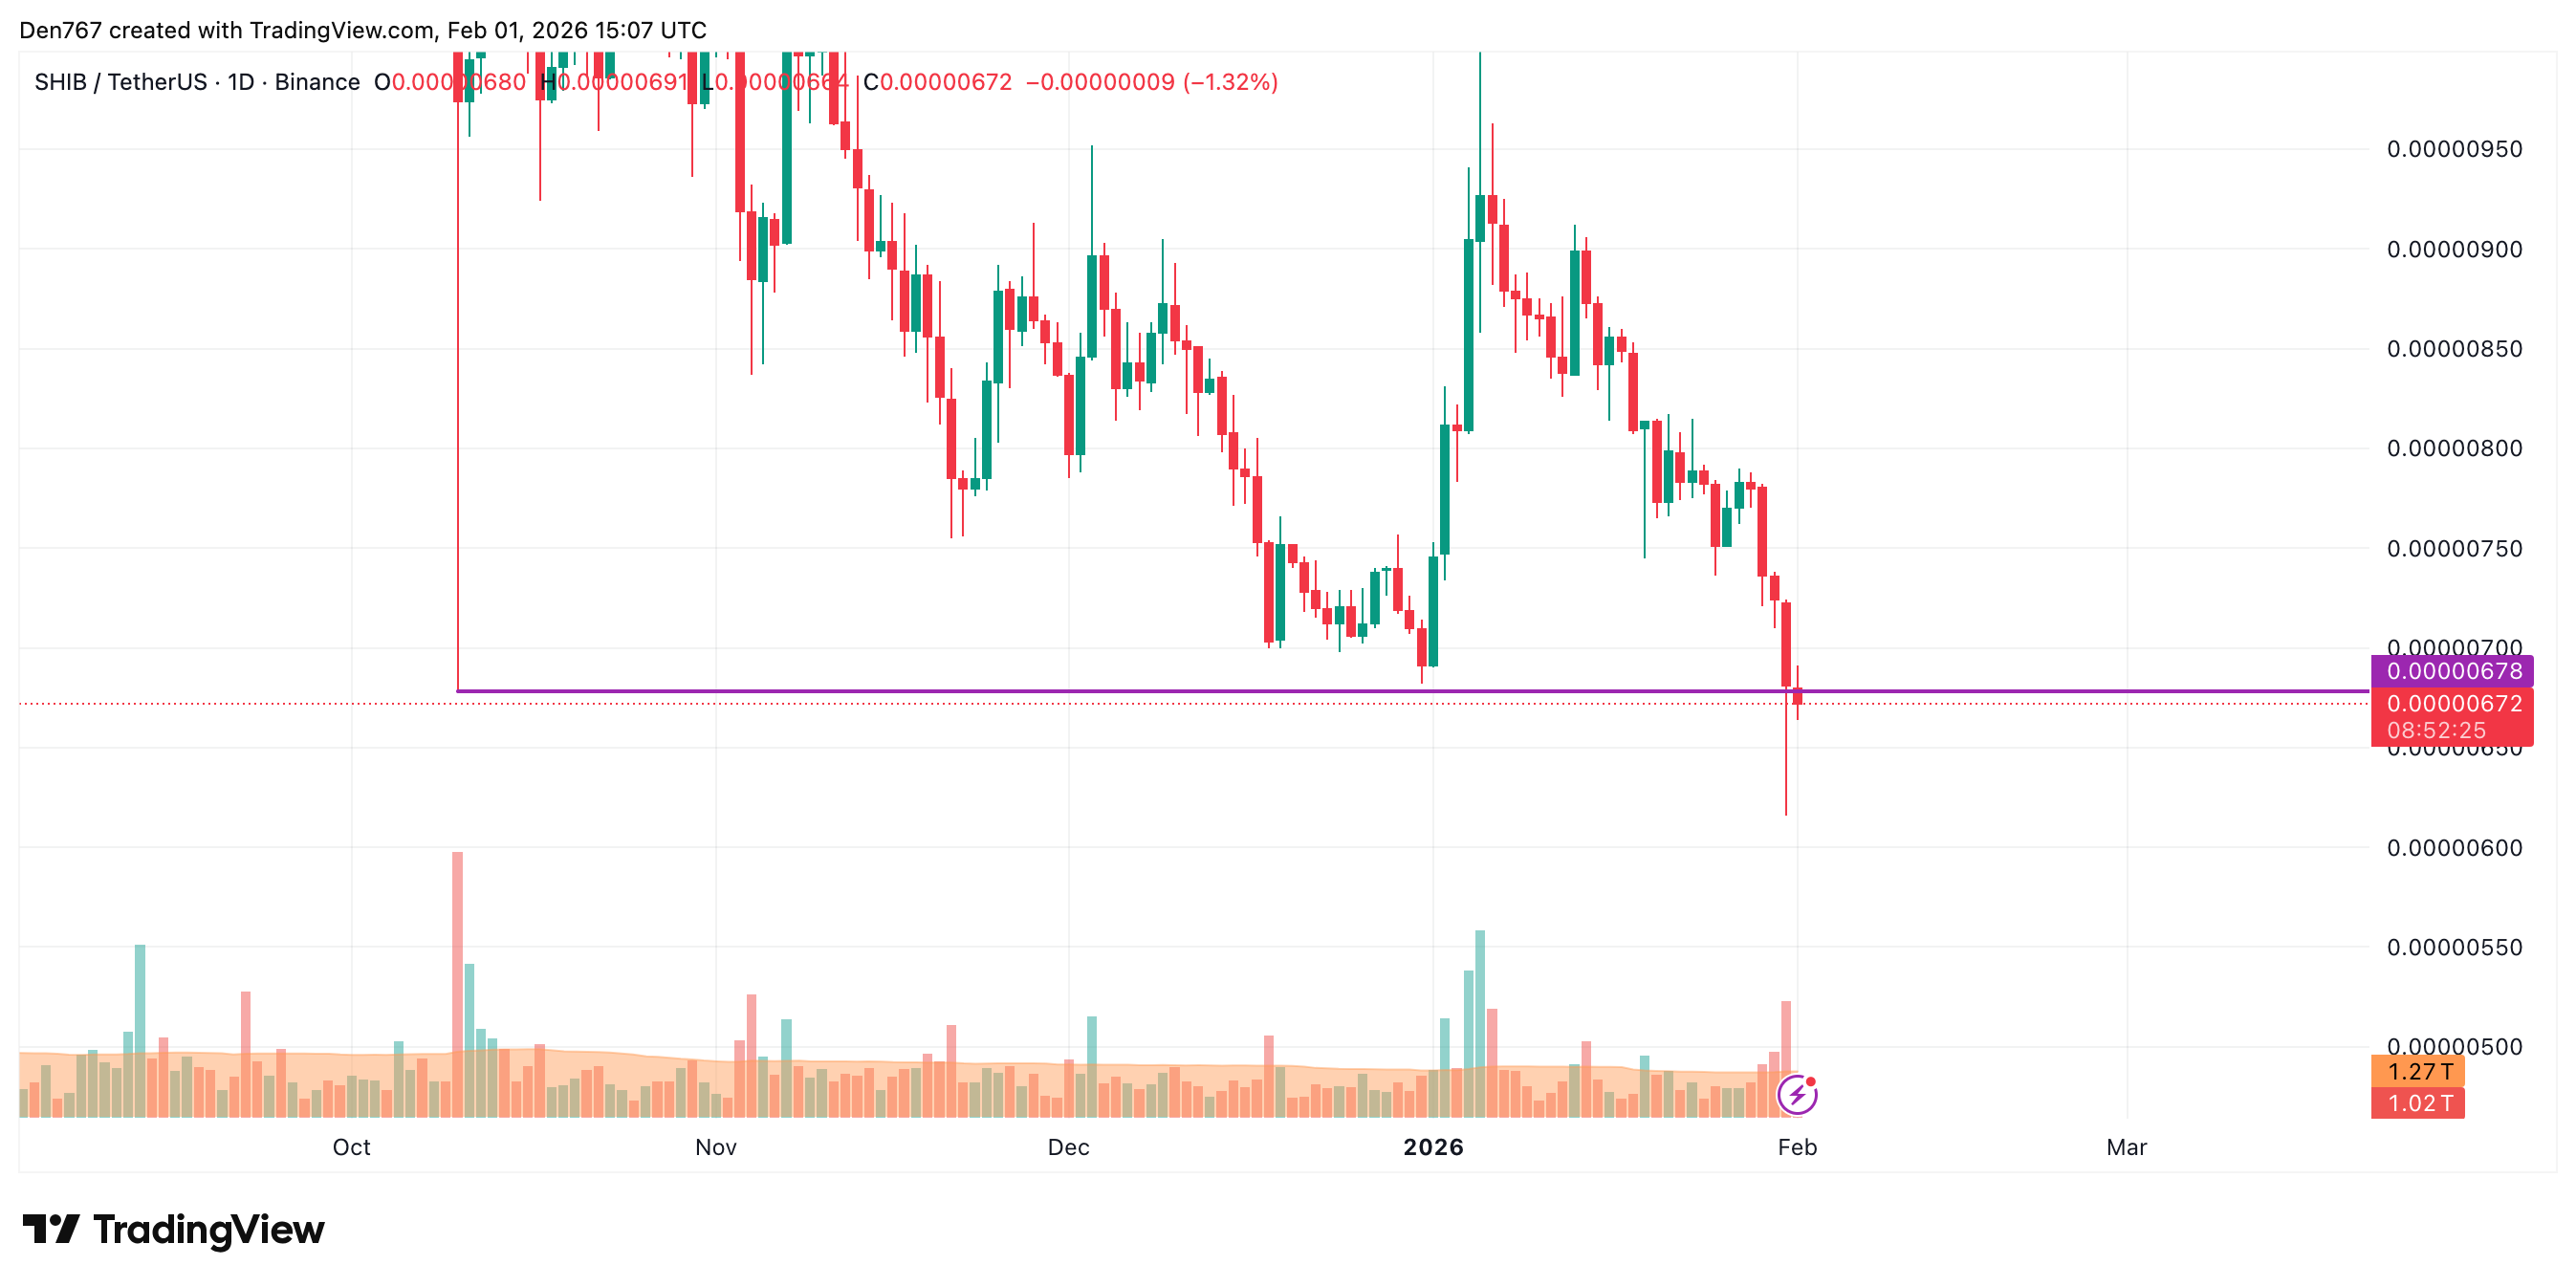
On the bigger time frame, there are also no reversal signals so far. In this case, one should pay attention to the nearest level of $0.00000678.

If a breakout happens, traders may witness a further decline to the $0.00000600 zone over the next few days.
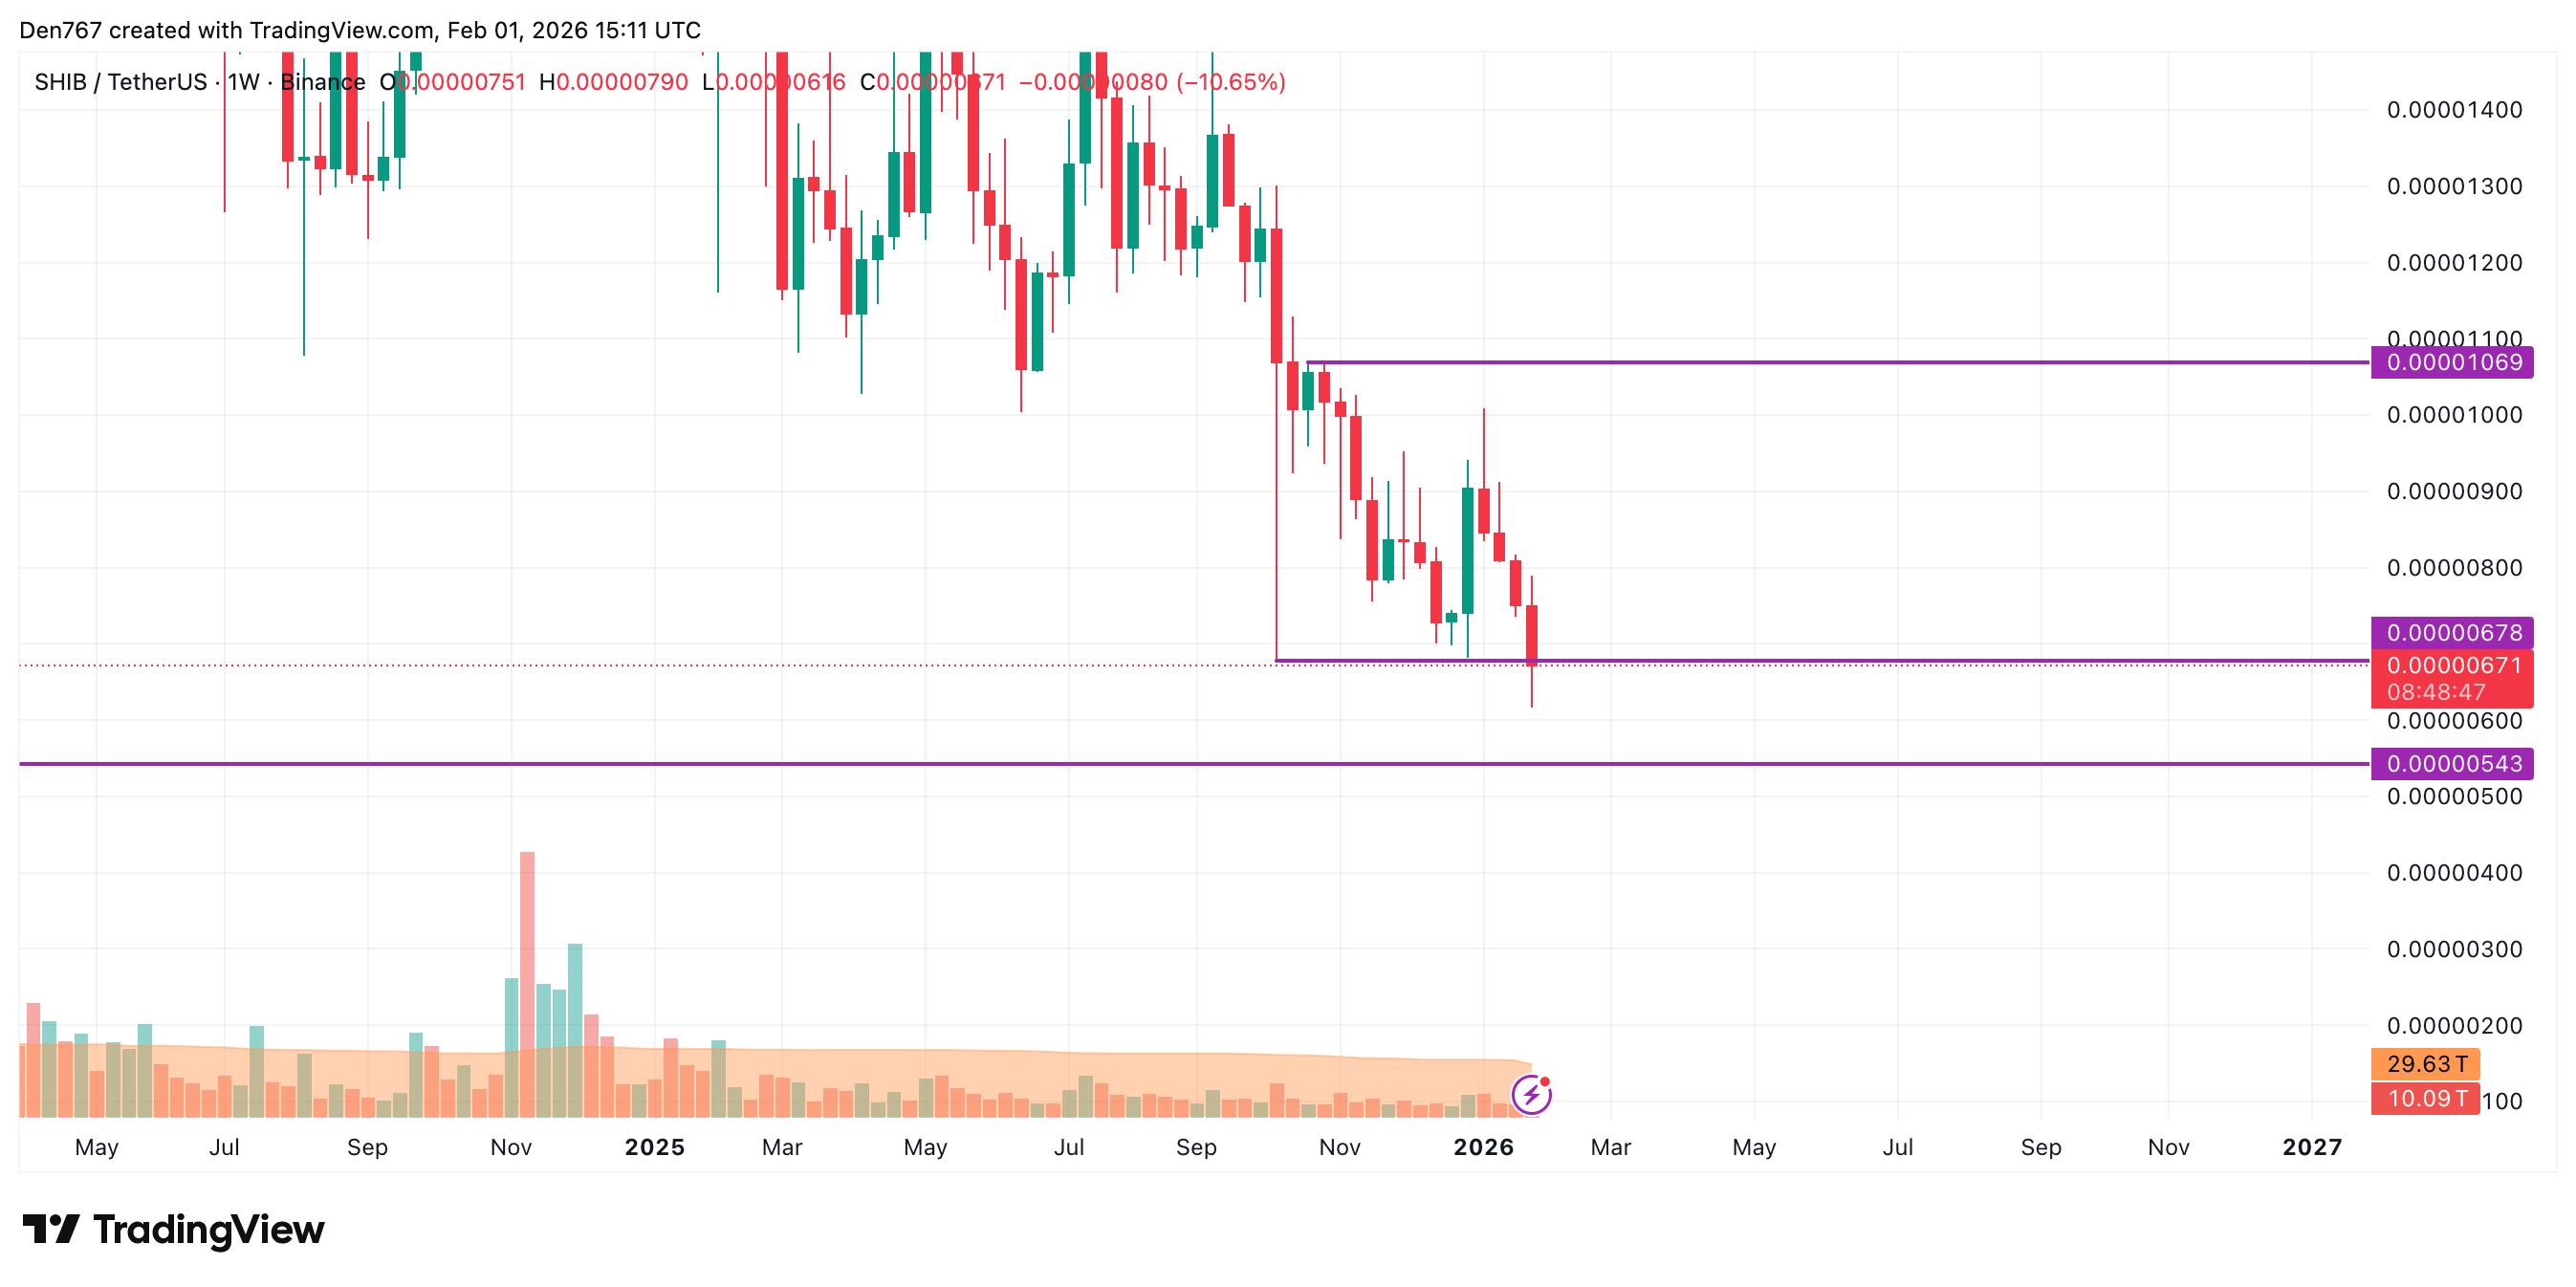
A similar picture is on the weekly time frame. If sellers' pressure continues, the accumulated energy might be enough for a dump to the next support level at $0.00000543.
SHIB is trading at $0.00000671 at press time.
 Denys Serhiichuk
 Tomiwabold Olajide
 Dan Burgin
 Gamza Khanzadaev