

Disclaimer: The opinions expressed by our writers are their own and do not represent the views of U.Today. The financial and market information provided on U.Today is intended for informational purposes only. U.Today is not liable for any financial losses incurred while trading cryptocurrencies. Conduct your own research by contacting financial experts before making any investment decisions. We believe that all content is accurate as of the date of publication, but certain offers mentioned may no longer be available.

Cardano (ADA): Holding near $0.20 support; above $0.22 could reopen $0.24-$0.26.
Hyperliquid (HYPE): Correcting near $77; holding $76-$78 keeps $82-$90 in play.
Shiba Inu (SHIB): Support sits near $0.0000050; bulls need $0.0000055-$0.0000057, but the demand for memecoin and risks in general is falling.
Stellar (XLM): Range-bound near $0.178; reclaiming $0.19 would improve the outlook.
Cardano's correction is shallow
Although Cardano is still in a recovery structure, its momentum has significantly decreased since ADA was unable to prolong its August breakout. The token is currently trading at about $0.205, which puts it in close proximity to a significant cluster of short- and medium-term moving averages.
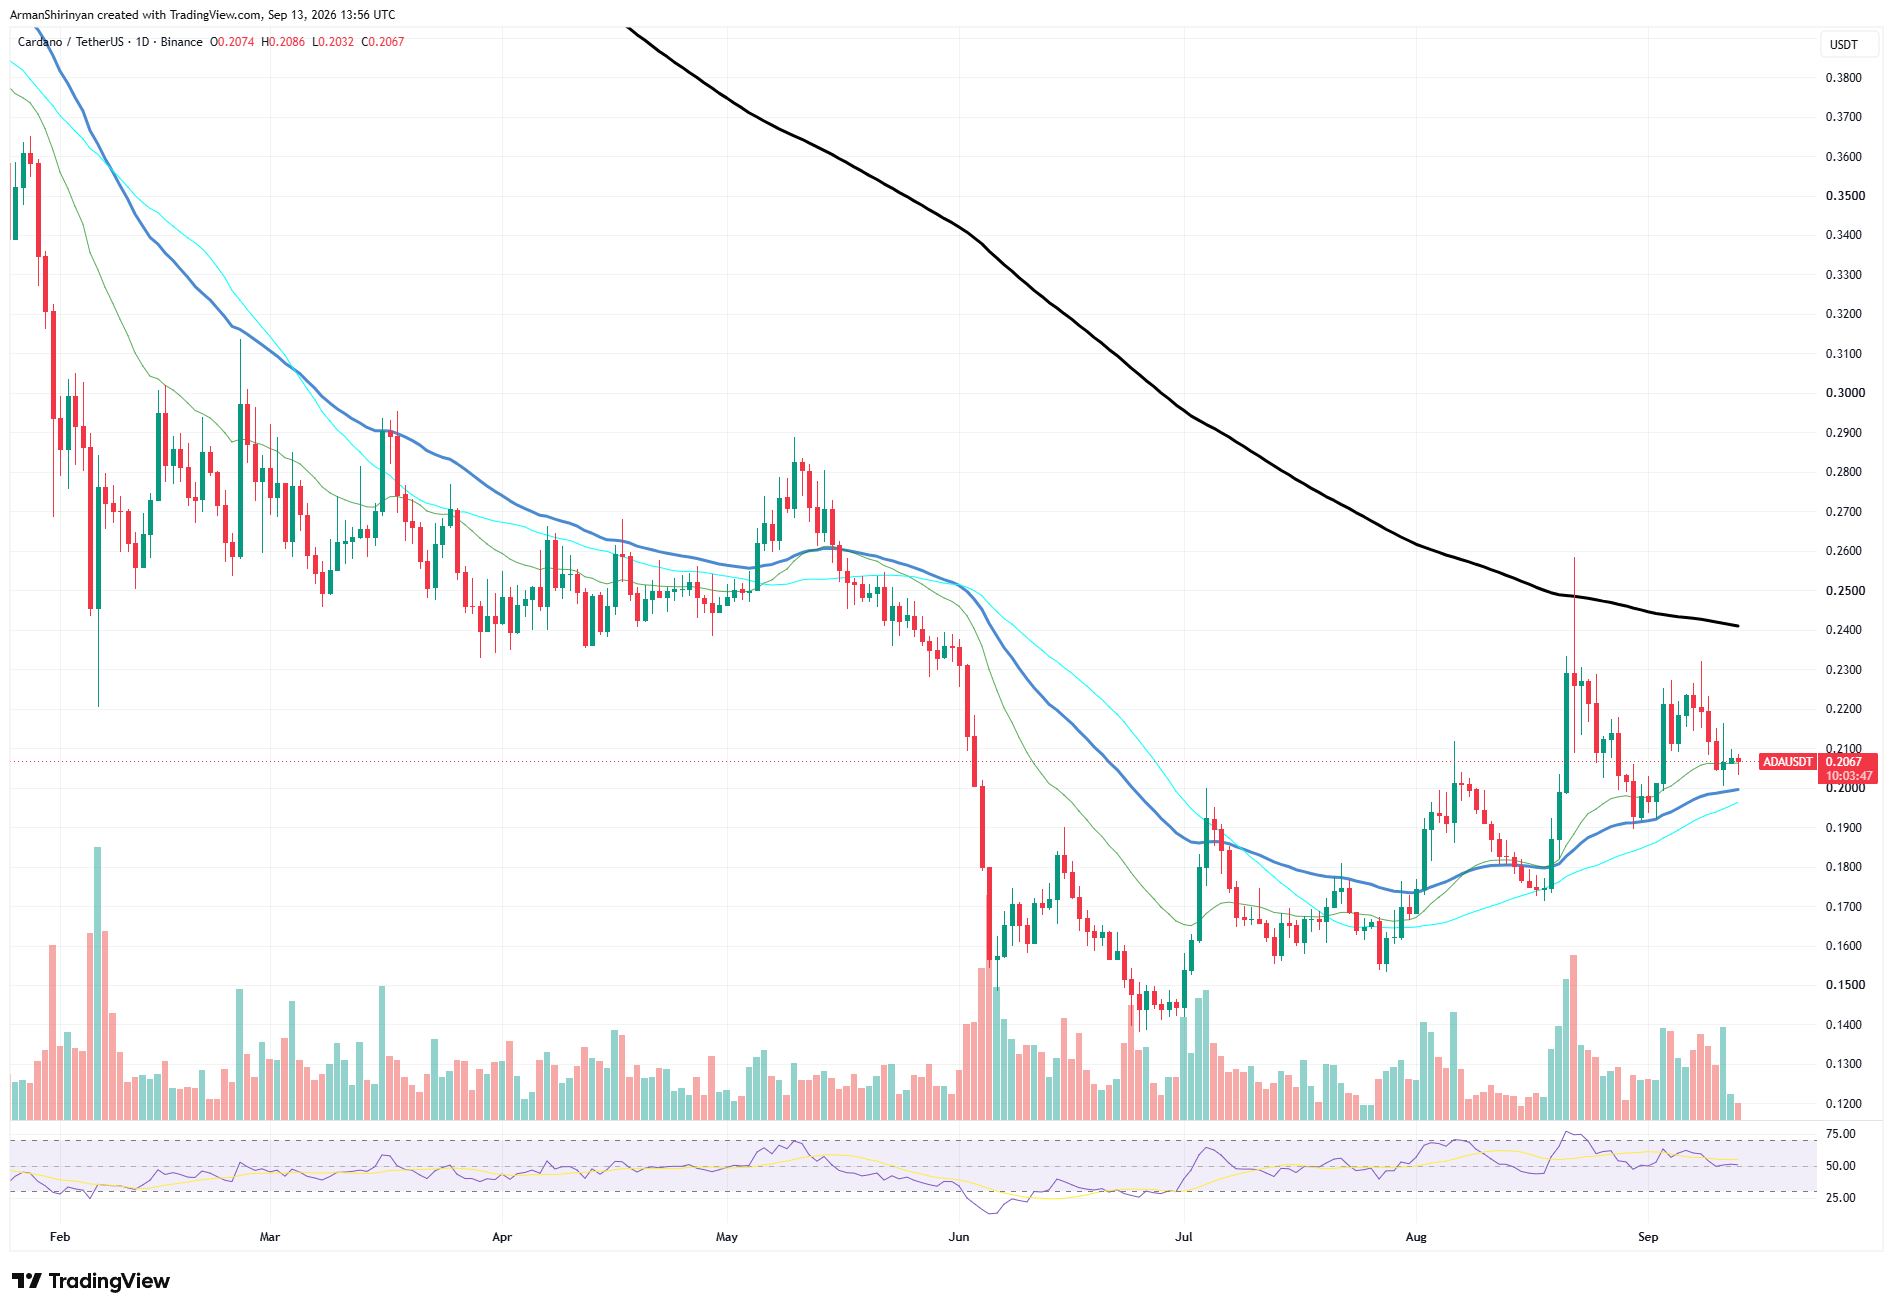
After the price hit a low of about $0.14 in late June, ADA's broader recovery got underway. The asset was then driven through $0.18 and $0.20 by buyers, with the strongest August impulse momentarily reaching about $0.26. That move, however, was rejected almost instantly after meeting the declining long-term moving average.
ADA has since developed resistance between $0.22 and $0.23. Recent candles indicate that the price is progressively moving back toward $0.20, while multiple attempts to move through this region have failed.
The $0.195-$0.20 support zone is crucial to the immediate technical picture. Bulls have a comparatively strong defensive area because multiple moving averages converge there. Losing it might expose $0.18-$0.185 and threaten the higher-low structure that has been in place since June.
The RSI has been falling and is currently close to neutral territory at 50, suggesting that neither side has significant momentum at the moment. Before another attempt at $0.24–$0.26 becomes feasible, ADA must recover $0.22.
Hyperliquid's correction
Although Hyperliquid is going through a much more severe correction, its overall trend is still far stronger than that of ADA. HYPE is currently trading at about $77.90, which is lower than its September peak of about $89. The drop comes after an incredible August rally that took HYPE from about $52 to nearly $90, a roughly 70% increase at its peak.
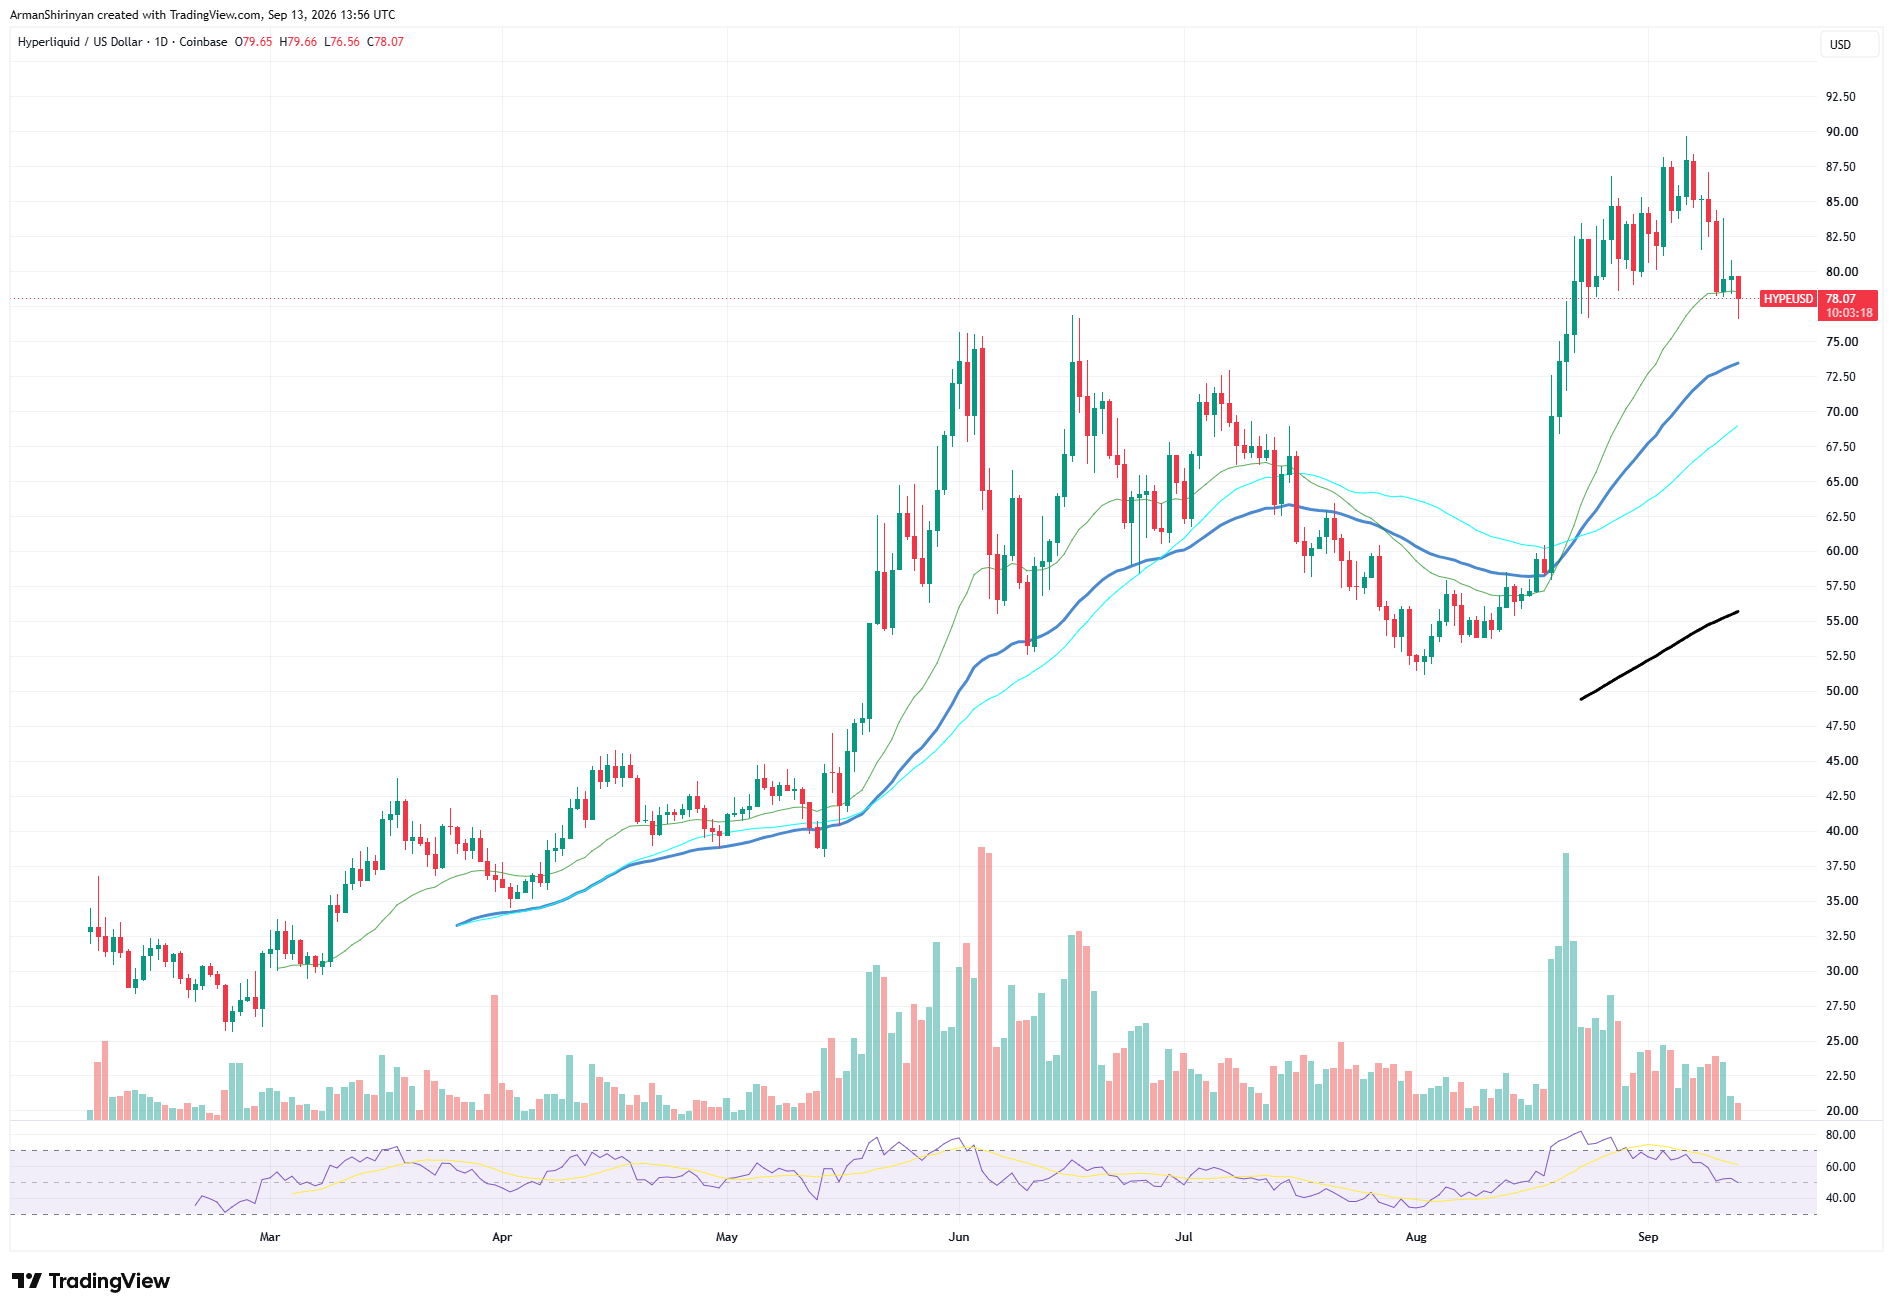
The short-term momentum is the issue. HYPE is currently testing its quickly rising short-term moving average after falling below $80. After previously reaching overbought territory, the RSI has dropped toward the low-50 range, indicating that buying pressure has considerably diminished.
As a result, the first significant support to keep an eye on is the $76–$78 range. HYPE might consolidate before trying to recover $82–$84 if buyers defend it. If that resistance is broken, $87–$90 will once again be in focus.

A clean loss of $76 would significantly alter the short-term outlook. Around $73 is the next significant dynamic support, and the $68–$69 range comes next. HYPE is still above its major medium- and long-term moving averages in spite of the correction.
The current decline appears more like a correction of the August–September advance than confirmation of a more significant bearish reversal, at least until those structures start to fail.
Shiba Inu's dynamic
Shiba Inu is still caught between a much larger bearish structure and better short-term support. After multiple unsuccessful attempts to prolong the September recovery above $0.0000055, SHIB is currently trading at about $0.00000521. The price is not as high as the improvement.
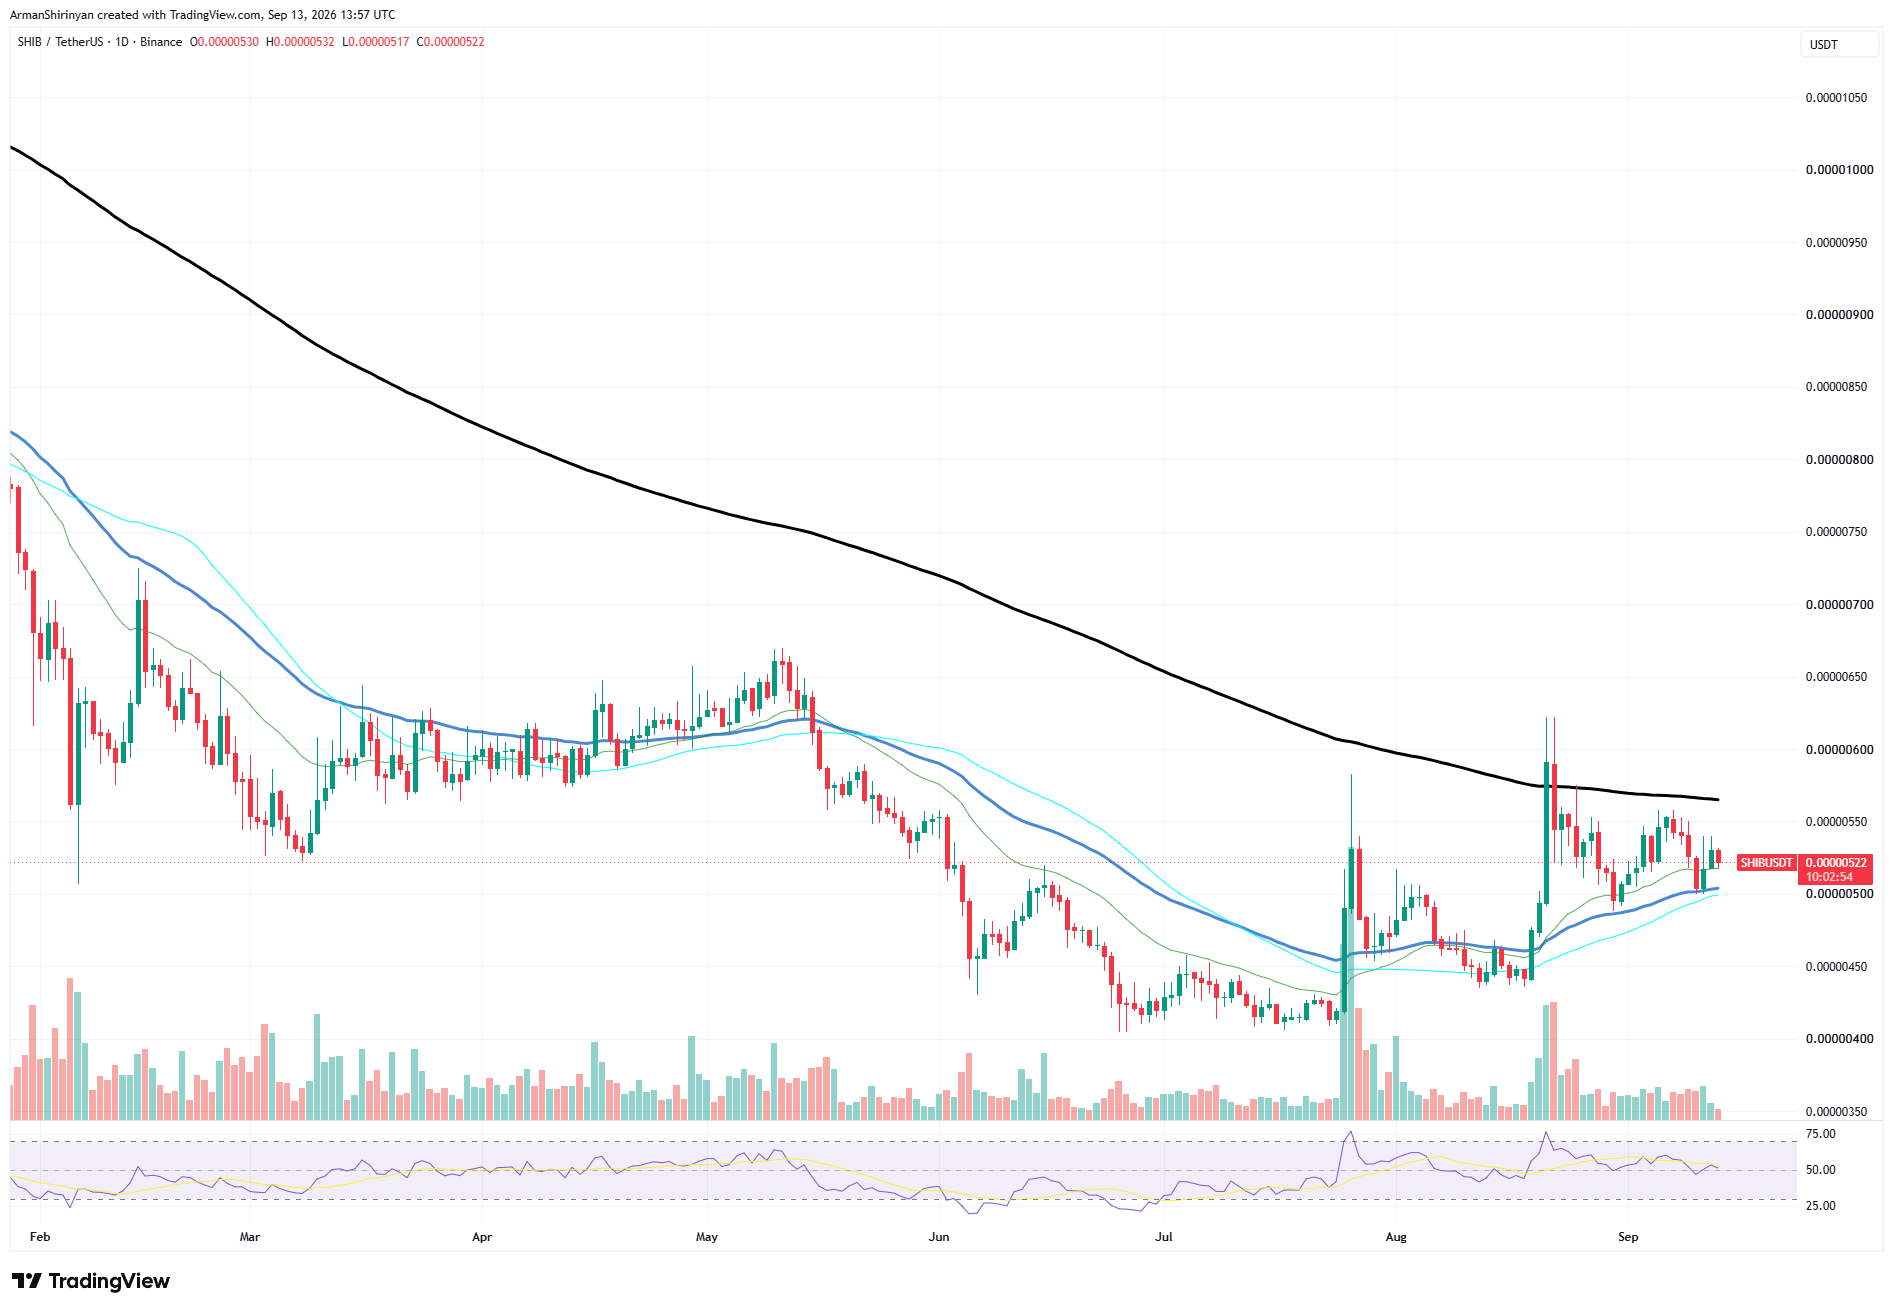
A cluster of rising short- and medium-term moving averages around $0.0000050-$0.0000051 is still above SHIB. Since late August, buyers have repeatedly defended this area, resulting in a series of higher lows in contrast to the July bottom at $0.0000041.
Nevertheless, the long-term moving average continues to be a significant obstacle. SHIB has not been able to establish itself above it, and it is still declining around $0.0000056-$0.0000057.

The August spike quickly peaked at about $0.0000062 before abruptly declining. There is no strong directional signal from momentum. While trading volume has significantly decreased from the levels observed during the prior breakout attempts, the RSI is currently hovering near 50.
The immediate support for SHIB is represented by $0.0000050. If it is lost, $0.0000047-$0.0000048 may be exposed. Before the broader technical picture becomes convincingly bullish, bulls must break $0.0000055-$0.0000057.
Stellar's proper positioning
Stellar's structure is even more compressed. At $0.178, XLM is essentially positioned inside a dense cluster of moving averages for the short and medium terms. The token's June surge toward $0.30 has entirely unraveled, and subsequent rallies have resulted in ever-weaker peaks.
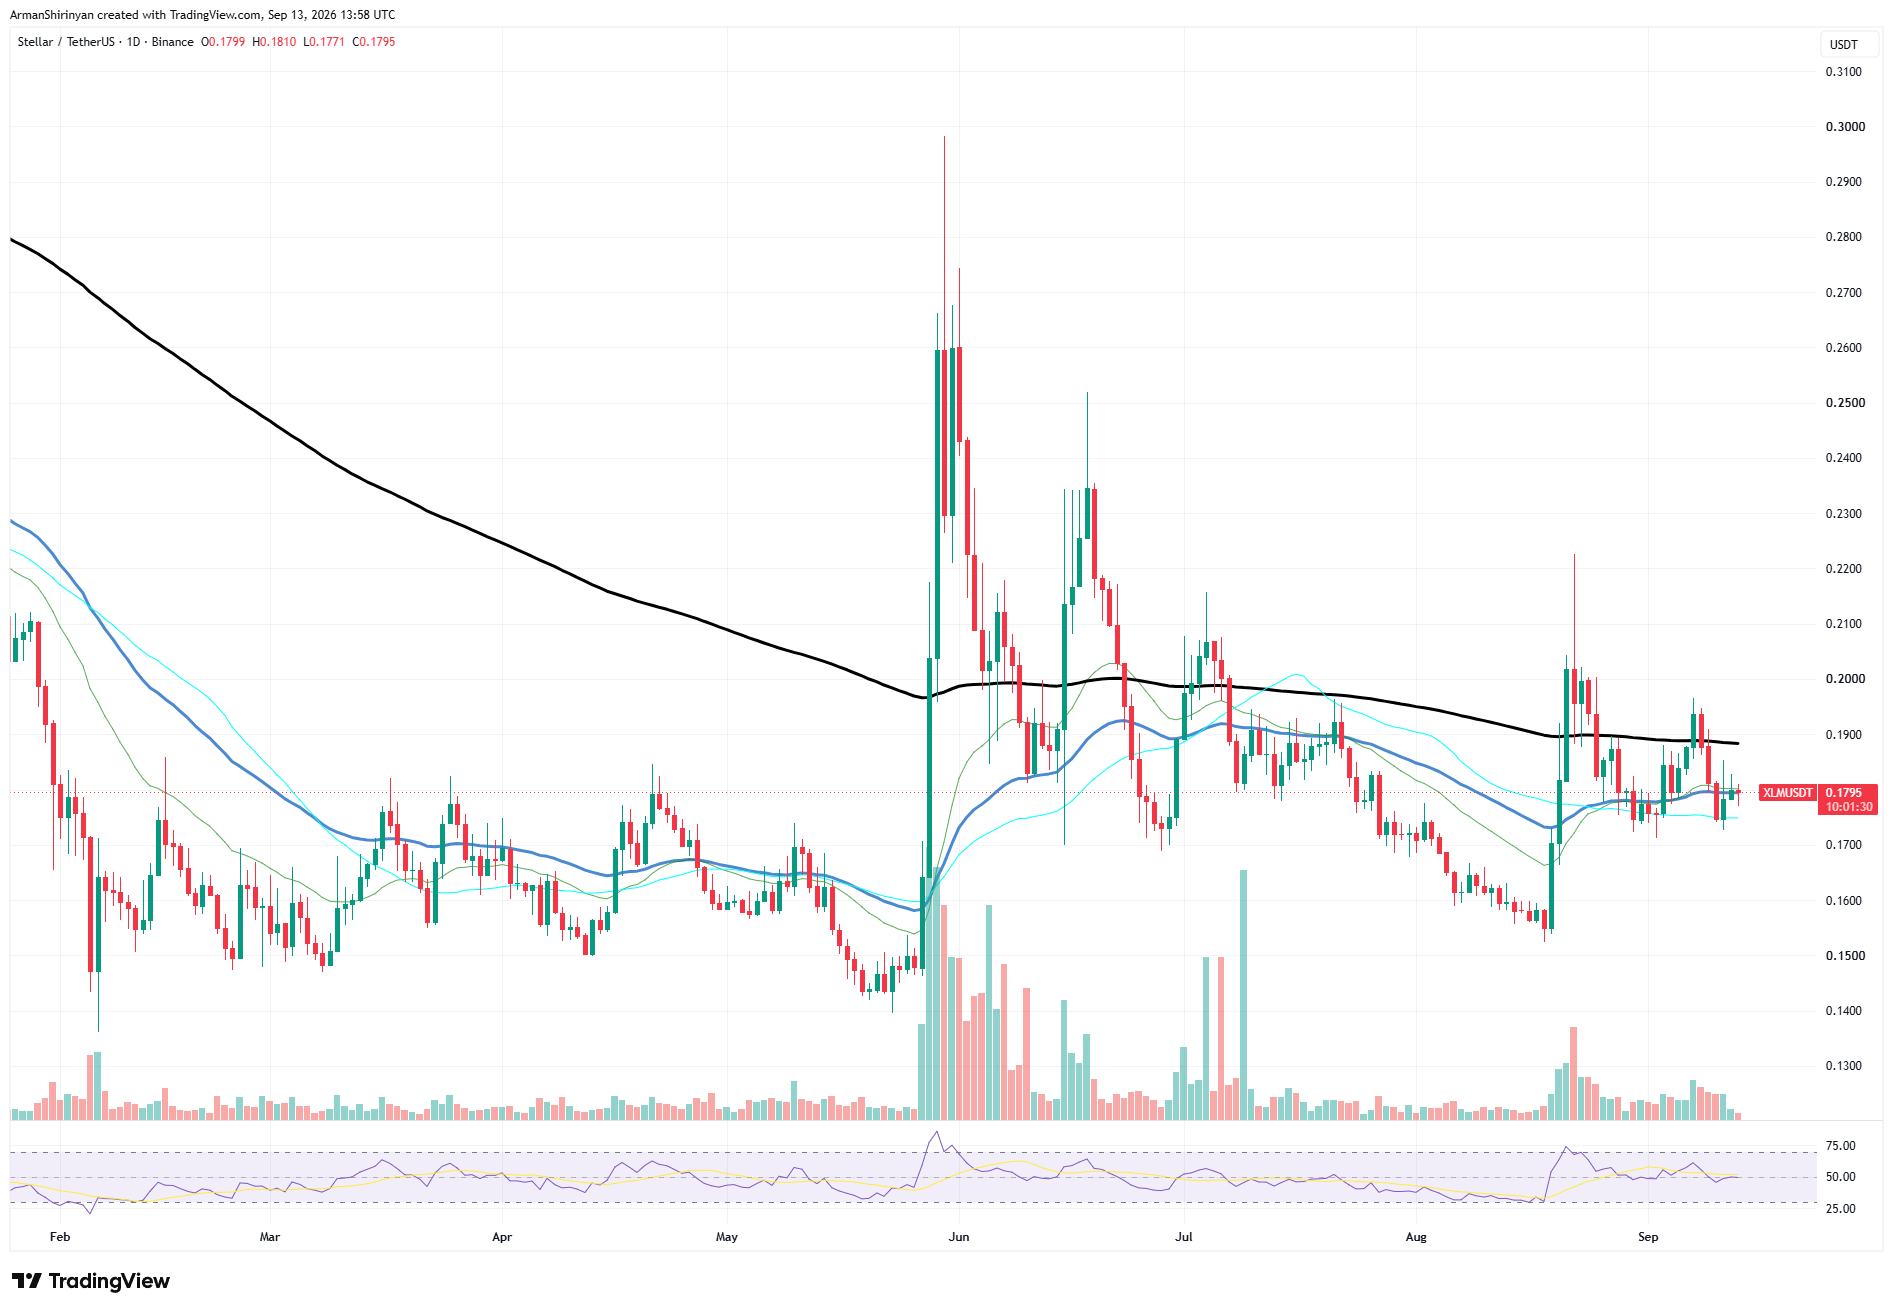
The most recent attempt in September hit about $0.195 before sellers pushed back. Most significantly, XLM is still below its declining long-term moving average, which is located between $0.188 and $0.190. It is the main level that bulls need to recover because it has frequently served as resistance.
The short-term support range is between $0.173 and $0.175. A breakdown below this range would expose $0.165 and possibly the August low between $0.155 and $0.160. Around 50, the RSI is nearly neutral, indicating that there is no directional momentum. After the initial spike in September, volume has also decreased.

As a result, XLM is still range-bound rather than overtly bullish or bearish. The structure would significantly improve with a break above $0.19, and $0.20–$0.22 might reopen. Repeated rejection below the long-term moving average limits upside potential until that occurs.
 Dan Burgin
 U.Today Editorial Team
