
Disclaimer: The opinions expressed by our writers are their own and do not represent the views of U.Today. The financial and market information provided on U.Today is intended for informational purposes only. U.Today is not liable for any financial losses incurred while trading cryptocurrencies. Conduct your own research by contacting financial experts before making any investment decisions. We believe that all content is accurate as of the date of publication, but certain offers mentioned may no longer be available.
One of the most peculiar on-chain configurations in recent months is being displayed by Shiba Inu. Exchange-related data indicates that actual selling activity among SHIB holders is remarkably low, despite ongoing weakness on the price chart and a wider downtrend that is still in place.
Shiba Inu back to exchanges
The number of exchange depositing addresses is currently only 7, according to the most recent on-chain metrics. Practically speaking, this indicates that only a small number of distinct addresses are actively transferring SHIB to exchanges, which are the usual venues for token sales. The figure indicates a very low level of distribution pressure, even though it is a moving average rather than a precise count of seven wallets.
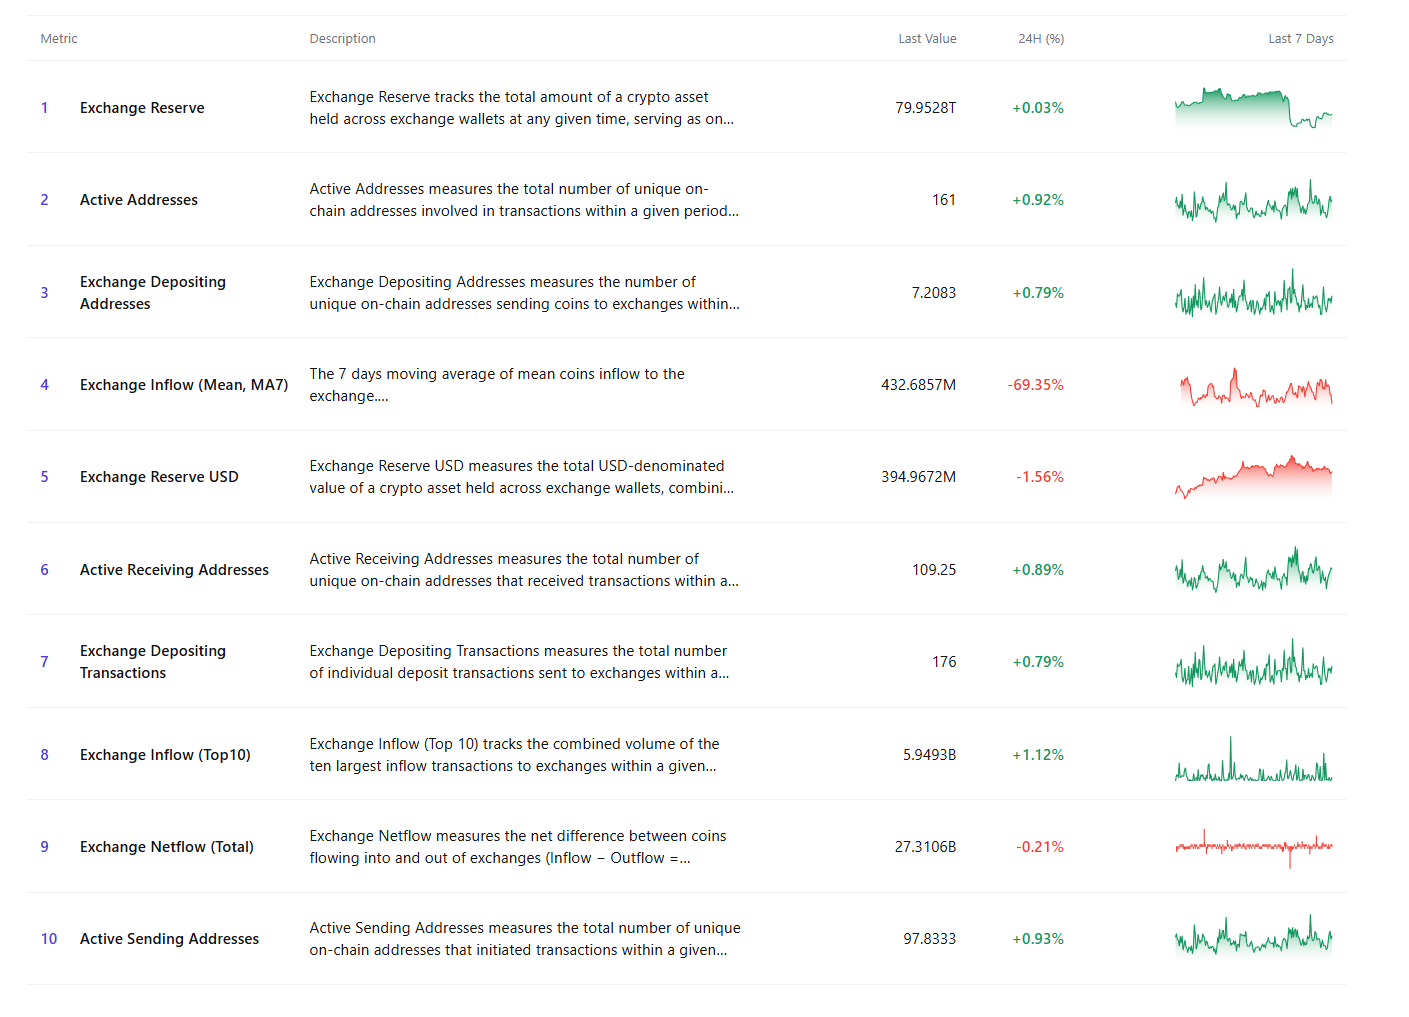
This interpretation is supported by the broader data. Over the past 24 hours, exchange inflow volume has decreased by more than 69%, suggesting that a much smaller number of tokens are making it to trading venues. Simultaneously, there have been minor increases in active addresses, active sending addresses, and active receiving addresses, indicating that network activity is stable rather than collapsing.
Shiba Inu's recovery attempts
Following a dramatic breakdown from a multi-month ascending structure, SHIB is making an effort to recover on the chart. The asset has gained some ground after rising from local lows close to the $0.0000045 area. Additionally, momentum metrics like the RSI have emerged from oversold territory, indicating that sellers are starting to lose control of the short-term trend.

A decrease in selling pressure should not be mistaken by investors for a verified bullish reversal, though. The 50-day and 100-day trends, which are still sloping lower, are among the important moving averages that the price is still below. The first significant obstacle that bulls must overcome is still the former support zone around $0.0000055, which now serves as immediate resistance.
The disparity between price action and exchange behavior is what distinguishes the current state of affairs. Long-term weakness is typically accompanied by an increase in exchange deposits, as investors scramble to sell their holdings. Rather, despite months of falling prices, SHIB holders seem comparatively reluctant to sell.
The market may gradually tighten if exchange inflows keep declining while demand remains stable. While this does not ensure an instant breakout, it does lessen one of SHIB's biggest risks: persistent selling pressure from current holders. The market is currently in a far stronger position than the chart alone might suggest, because the data indicates that the majority of SHIB investors are opting for patience rather than panic.
 U.Today Editorial Team
 Dan Burgin