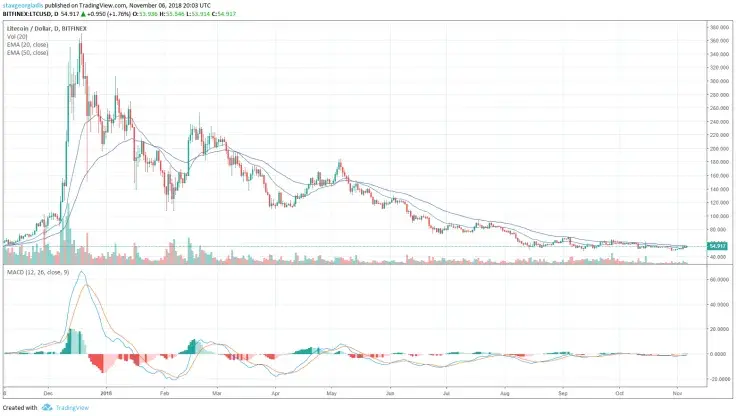
A breakout may be approaching:
· 1-year high: $365.524
· 1-year low: $49.22
Current price as of Nov. 7, 2018, is $55.17.

Bollinger bands on the yearly chart are in a narrow range: a lower band at $49.17, a higher band at $55.78. Usually, this tight range and consolidation anticipate a breakout. So what direction the breakout will take?
The strength of the trend measured by the Average Directional Movement indicator is very weak, currently at 15, with a level below 25 indicating a weak trend. Still, the dominant trend is +DI at 26.60 over -DI at 20.24 suggesting that there is a slight tendency towards an upward breakout. The recent price is below the daily 50-period exponential moving average at $55.41 but above the daily 20-period exponential moving average at $53.01.
A close above the 50-period daily exponential moving average is a good sign that the recent downtrend may be bottoming.
The MACD indicator is still negative, although flat, pointing to a directionless movement. Stochastic Indicator (14,3,3) is approaching overbought levels near 80.0 level; Williams %R (14) indicator is at overbought levels, currently at the -15.38 level; and as we mentioned before, the momentum indicator is flat since the trend is very weak.
Daily Pivot Points
|
Name |
S3 |
S2 |
S1 |
Pivot Points |
R1 |
R2 |
R3 |
|
Classic |
50.334 |
51.457 |
52.454 |
53.577 |
54.574 |
55.697 |
56.694 |
There is support at $48.29 and $51.54 and resistance at $66, $74.80 and $94.30 and then at $108.30.
It is better to be in a wait-and-see mode as bottoming is yet to be confirmed. An upward breakout cannot yet be supported, and the recent consolidation of the high-low price of about $65–$48 may last more as it already counts almost three months as of late summer 2018. For the trend to change from downward to upward, the price should close about the previous highs of $69 and $93.
 Godfrey Benjamin
 Tomiwabold Olajide
 Dan Burgin
 Caroline Amosun