

Disclaimer: The opinions expressed by our writers are their own and do not represent the views of U.Today. The financial and market information provided on U.Today is intended for informational purposes only. U.Today is not liable for any financial losses incurred while trading cryptocurrencies. Conduct your own research by contacting financial experts before making any investment decisions. We believe that all content is accurate as of the date of publication, but certain offers mentioned may no longer be available.

Following one of the biggest market rallies of the year, Hyperliquid is currently experiencing its first significant correction. Before sellers intervened forcefully and drove HYPE back towards the crucial $58 support zone, the asset briefly traded close to the $75–76 range. The fact that HYPE is still above its 100-day EMA at $57 is the strongest directional signal right now.
This moving average, which served as dynamic support during the advance, is currently being tested for the first time since the breakout. The larger uptrend would continue if this level were maintained. But momentum is obviously losing ground.
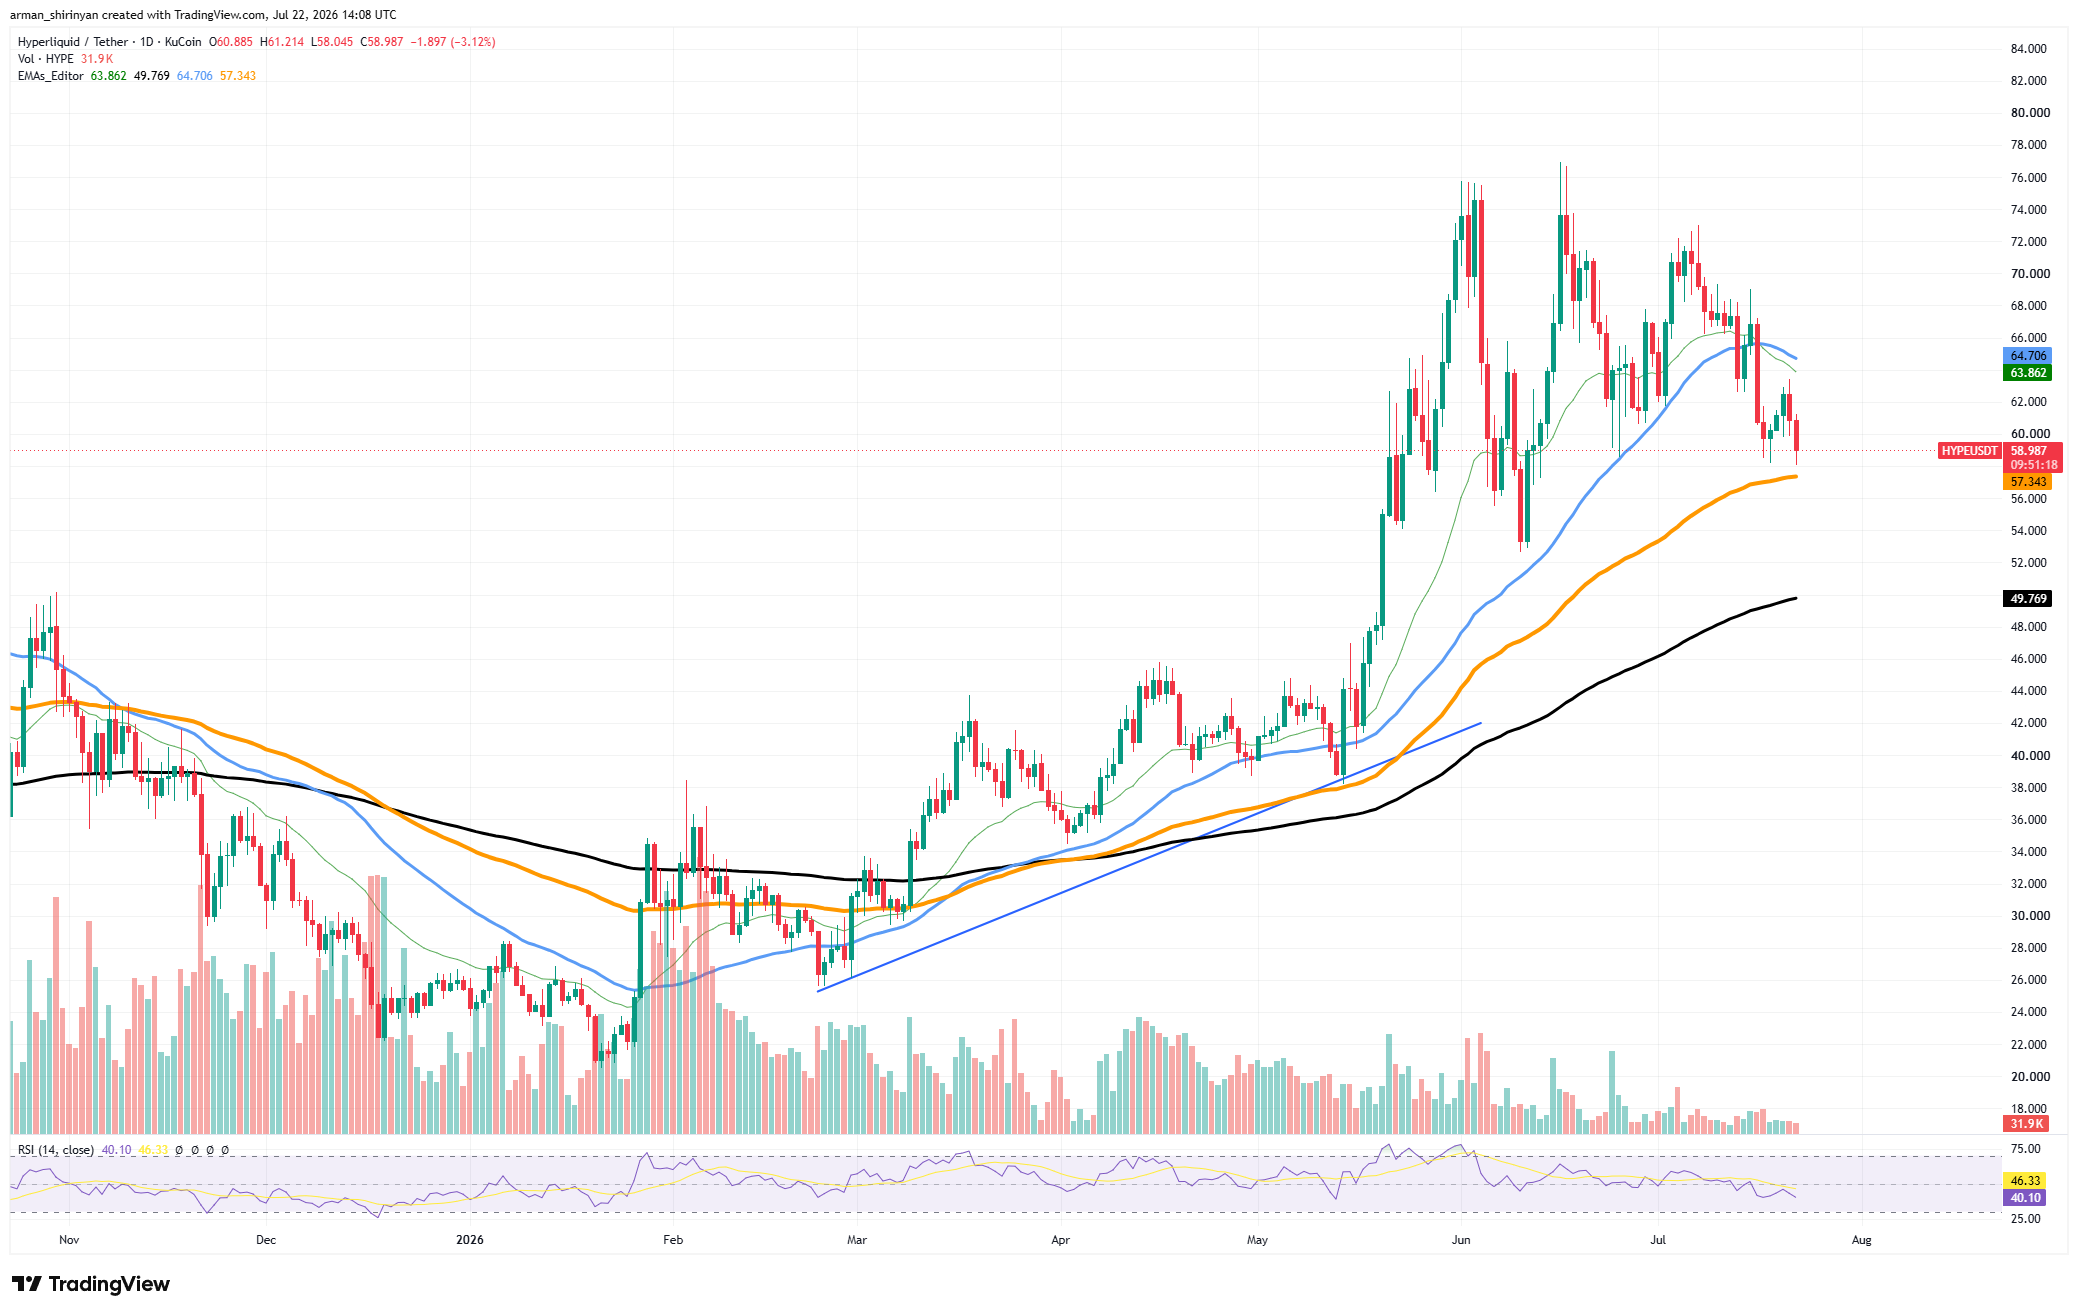
Daily candles continue to display lower highs since the June peak, the RSI has dropped toward 40, and the 20-day EMA has rolled over. Compared to the buying frenzy that accompanied the move from $40 to above $70, volume has also significantly decreased. Bulls have good news: the long-term structure is still positive.
While the 50-day EMA is currently at $64.7, the 200-day EMA is still rising toward $50. Buyers might attempt another move toward $65 and ultimately $70 if HYPE can hold above $57-$58.
A deeper retracement toward the 200-day EMA around $50 would probably result from a clear breakdown below the 100-day EMA. HYPE is no longer in breakout mode at this time. The market is evaluating whether the prior rally was sustainable or overly speculative during this validation phase.
Near Protocol's Resistance
Despite being stuck within a wide consolidation range, NEAR is exhibiting much greater resilience than many other altcoins. NEAR has been building a base above its long-term trend indicators for several weeks, in contrast to HYPE, which is correcting following a significant rally. While the 200-day EMA near $1.82 still offers structural support, NEAR is trading directly above the 100-day EMA around $1.87.
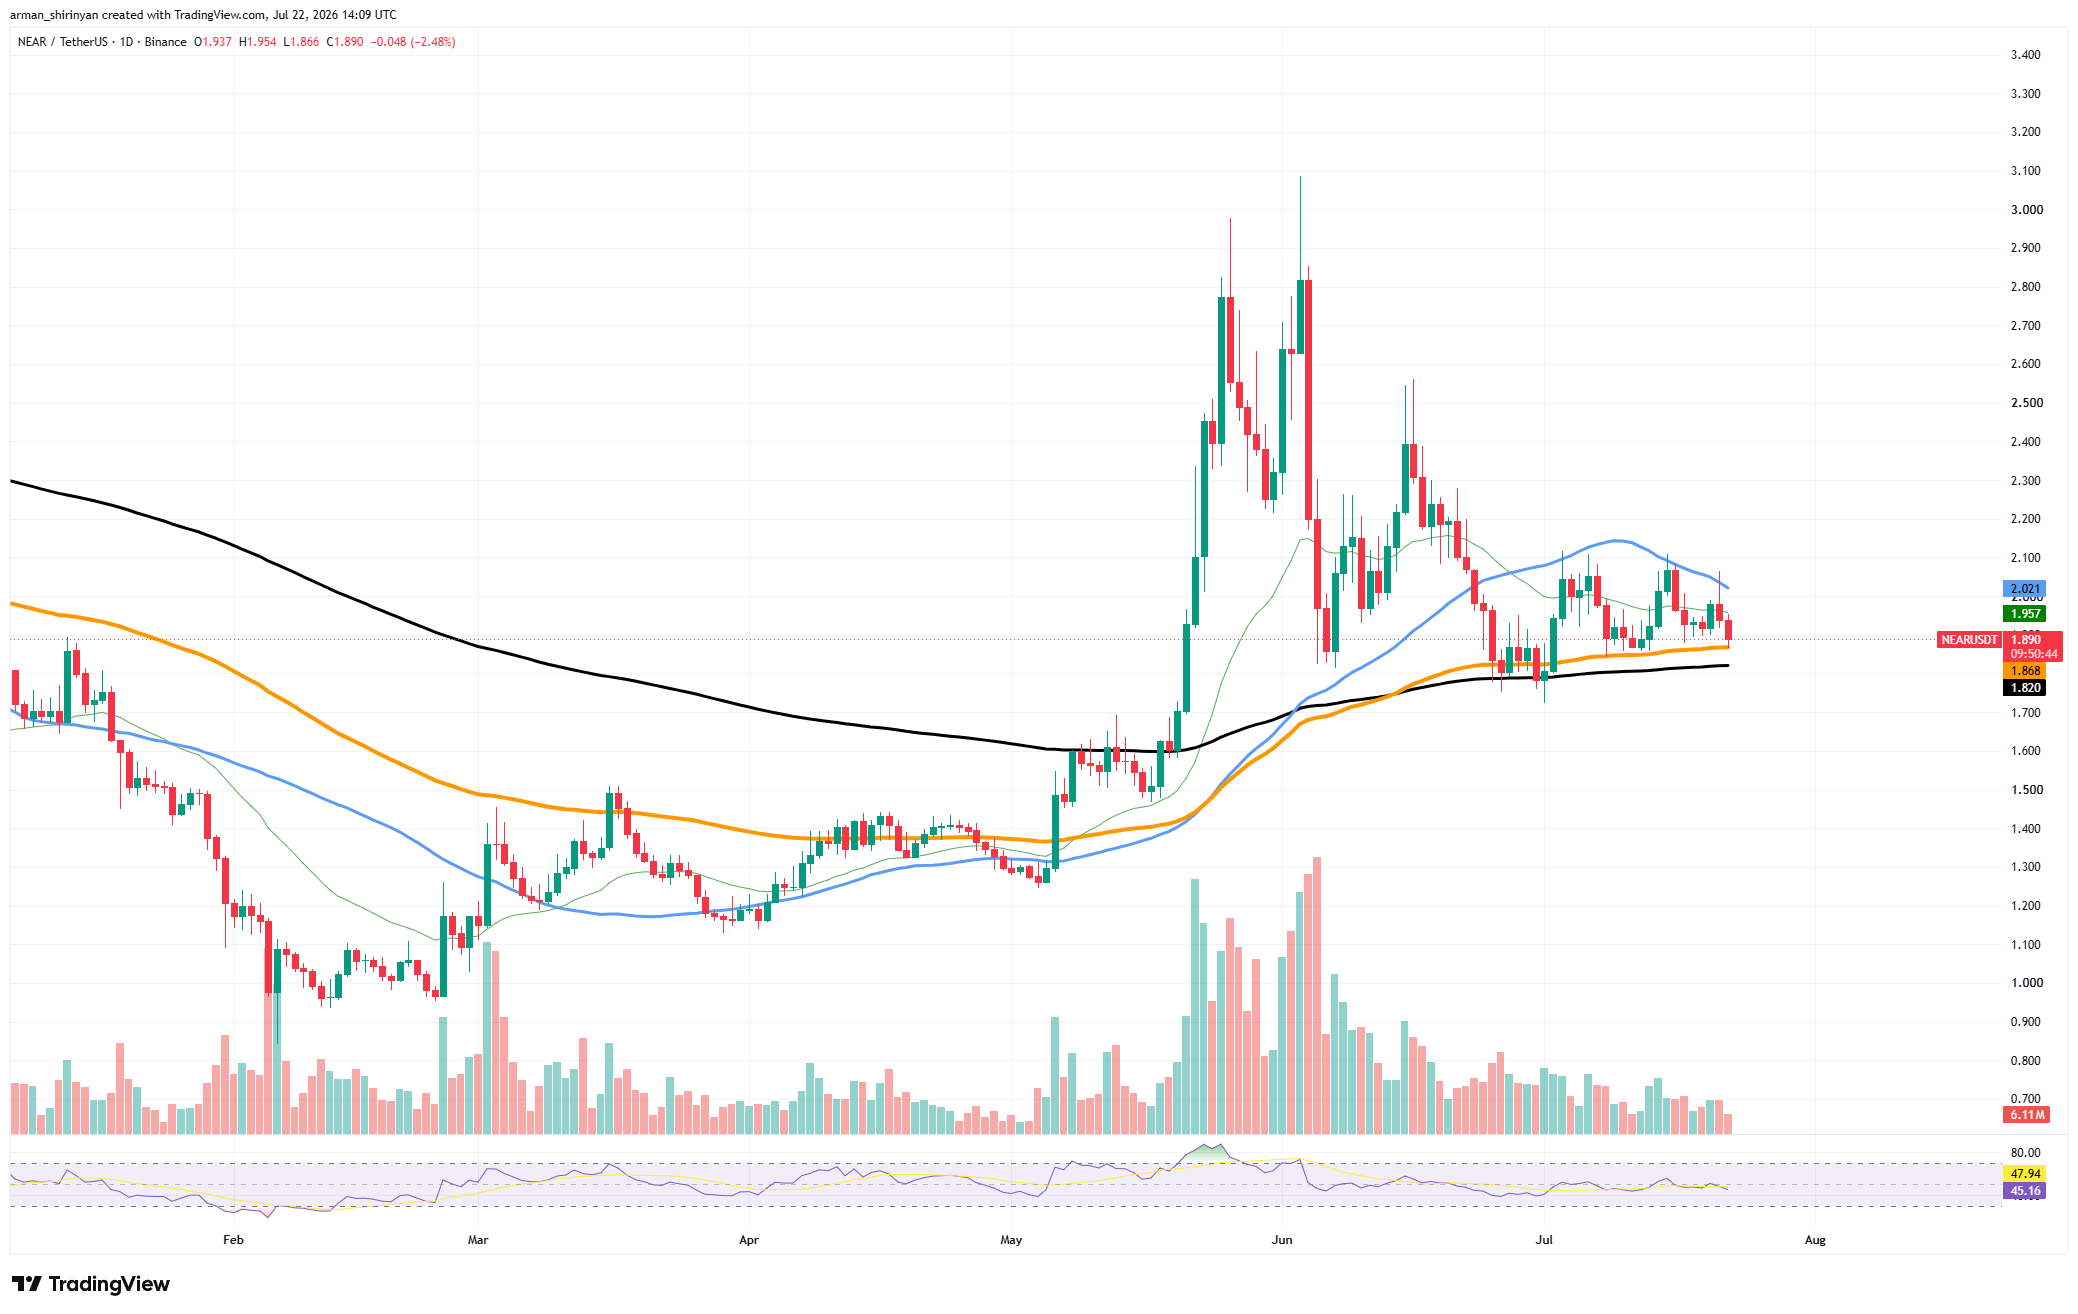
As a result, the support cluster between $1.82 and $1.87 is rather strong. Bulls have also failed to recover the 50-day EMA at $2.02. Over the past month, every attempt at a recovery has stalled in the $2.00–$2.10 range, creating a clear resistance area that needs to be broken before a long-term uptrend can begin. The current equilibrium is reflected by an RSI of about 45.
The sideways price movement observed throughout July is consistent with neither buyers nor sellers having established dominance. The overall outlook is still fairly optimistic. NEAR continues to print higher lows on the longer timeframe and has effectively recovered from sub-$1 levels earlier this year.

The predominant interpretation is accumulation as long as the asset stays above the 200-day EMA. $2.00 is the key level to watch. A clear breakout above it could put NEAR back above all significant short-term moving averages and pave the way for a move to $2.30–$2.50. On the other hand, much of the recovery structure developed over the previous few months would be rendered invalid if the $1.82 support zone were lost.
Shiba Inu Looks Weaker
From a technical standpoint, Shiba Inu is still among the weakest large-cap cryptocurrencies available. Every significant attempt at a recovery has been rejected at important moving averages, and the daily chart displays a consistent pattern of lower highs and lower lows that has persisted for nearly a year.
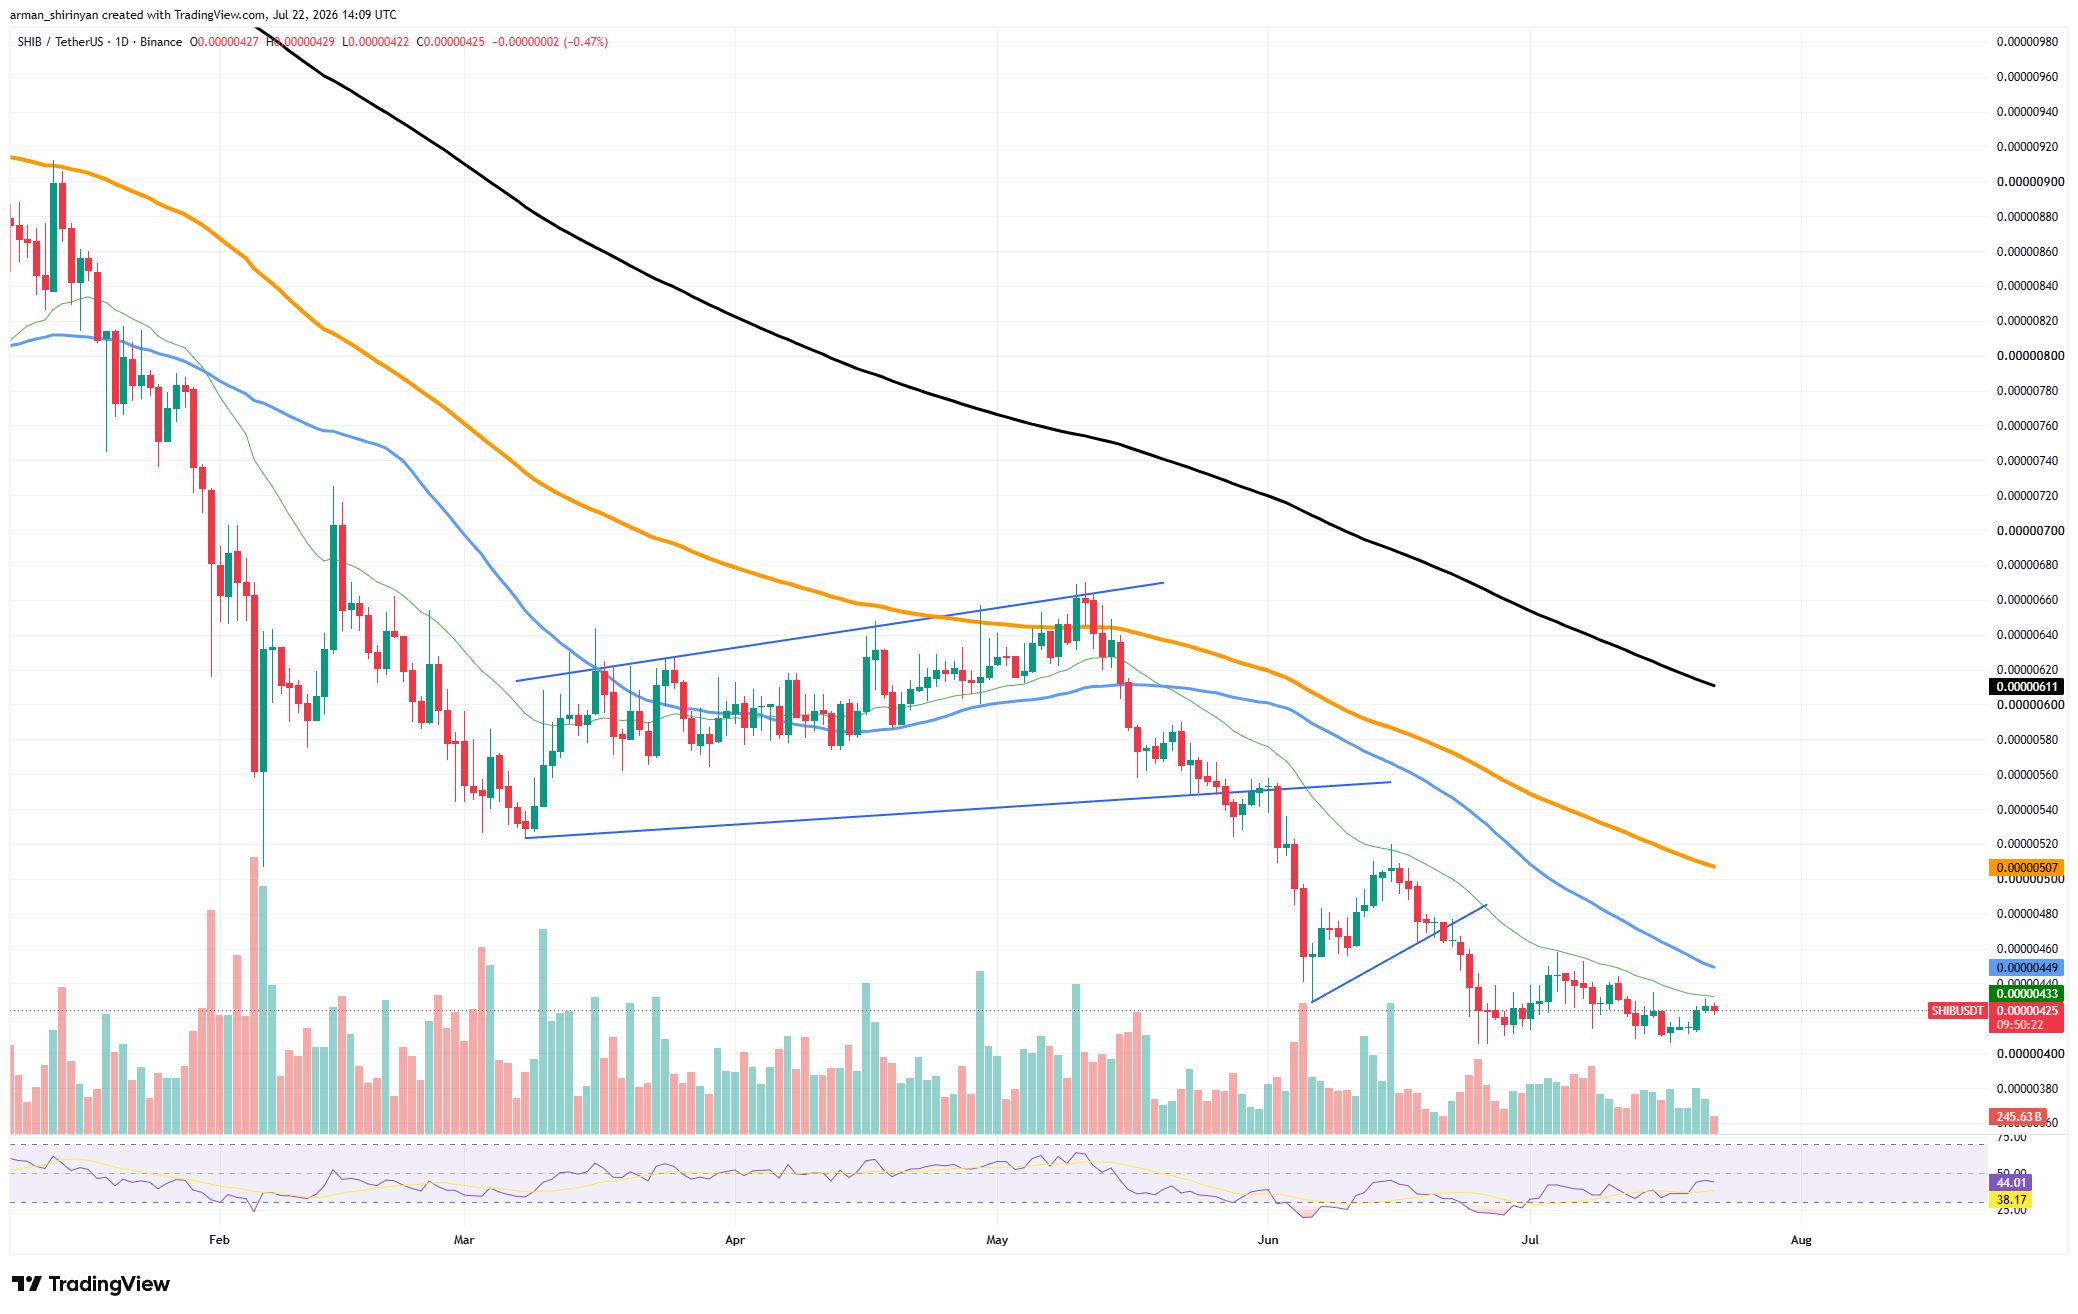
The failed ascending channel that formed between March and May is the chart's most noticeable feature. Sellers intervened close to the 100-day EMA and forced a breakdown below support, but SHIB momentarily appeared poised to establish a medium-term reversal. The asset has not been able to pick up steam since. At the moment, SHIB is trading below the 20-, 50-, 100-, and 200-day moving averages.
This alignment indicates weakness across all significant timeframes, making it one of the most obvious bearish structures. The first significant resistance level is still the 100-day EMA around $0.0000051, but the 200-day EMA around $0.0000061 is a much bigger barrier. On the other hand, there is a slight improvement. As the price stabilizes at $0.0000042, the RSI has recovered from oversold conditions and is progressively rising.

Additionally, volume has drastically decreased, indicating that aggressive selling pressure is starting to lessen. The issue for bulls is that renewed demand is not the same as waning selling pressure. A sustainable recovery narrative cannot emerge until SHIB breaks out above the declining moving-average cluster.
Until then, the current structure appears to be more of a consolidation following a decline than the start of a new uptrend. The first indication that buyers are regaining control would be a move above $0.0000045. SHIB would be vulnerable to another leg lower and its long-term bearish trend would be reinforced if current support levels were not maintained.
Dogecoin Does It Better
Dogecoin's chart is strikingly similar to SHIB's, but DOGE is marginally more resilient due to a few minor differences. The meme coin has also been in a downward trend for several months, but this decline has been less severe and more orderly than SHIB's. At $0.072, DOGE is currently trading below all major moving averages.
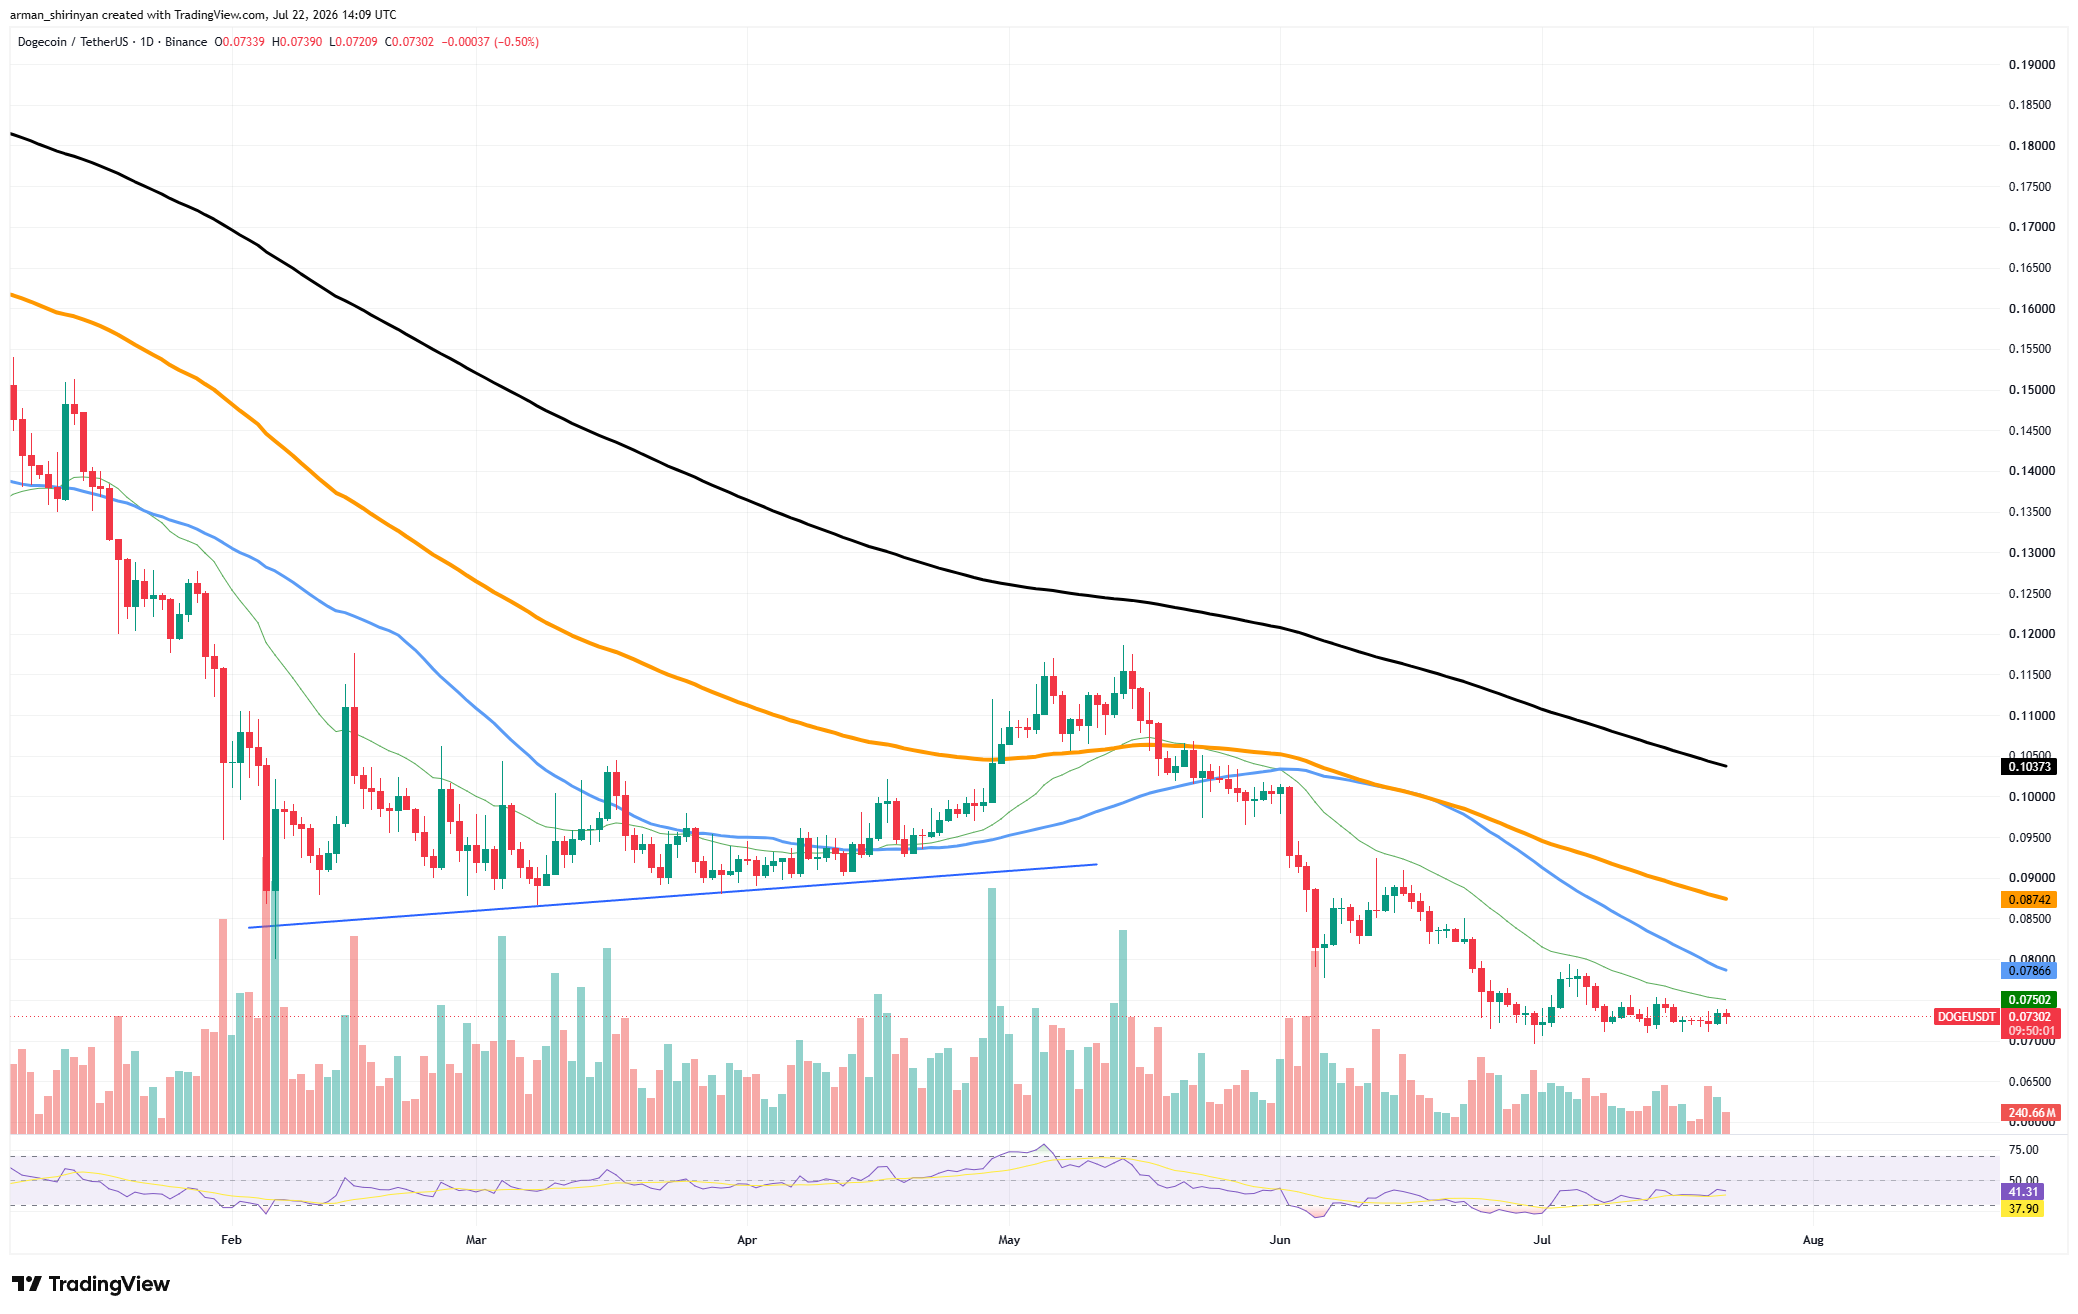
A stacked resistance zone is created directly overhead by the 20-day EMA at $0.075, the 50-day EMA at $0.078, and the 100-day EMA at $0.087. This implies that traders who made purchases at higher prices immediately put pressure on the market to sell during every upward move. The RSI shows weak momentum as it remains below the neutral 50 level.
However, DOGE is no longer generating significant downside extensions, in contrast to previous stages of the decline. Throughout July, the price has moved into a comparatively narrow trading range, indicating that volatility is decreasing. From a structural perspective, the recent lows around $0.07 remain the critical support.

A recovery toward $0.09 is conceivable if DOGE can maintain this zone and reclaim the 20-day and 50-day moving averages. That would be the first significant shift in the trend since May.
Although DOGE is currently more stable than SHIB, it is still technically bearish. The next few weeks are crucial for determining whether accumulation is occurring below the surface, as the market appears to be looking for a bottom rather than accelerating into a new wave of selling.
 U.Today Editorial Team
 Dan Burgin
