Disclaimer: The opinions expressed by our writers are their own and do not represent the views of U.Today. The financial and market information provided on U.Today is intended for informational purposes only. U.Today is not liable for any financial losses incurred while trading cryptocurrencies. Conduct your own research by contacting financial experts before making any investment decisions. We believe that all content is accurate as of the date of publication, but certain offers mentioned may no longer be available.
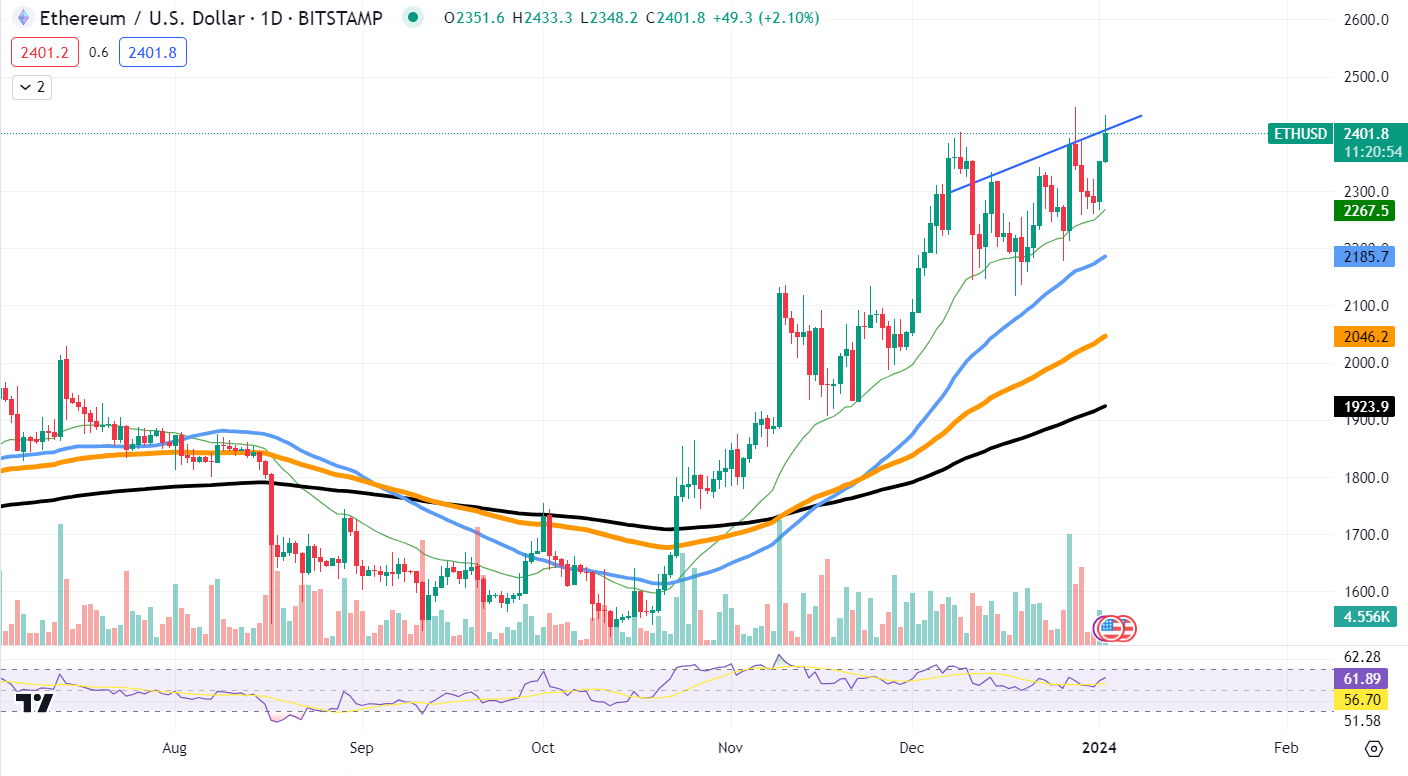
Ethereum is showing a steady performance on the market, approaching a critical resistance level at $2,400. Breaking this resistance level should push the asset closer to $2,500, especially if investors avoid a sell-off.
The Relative Strength Index is providing hints that the current trend could continue. The RSI, positioned above the median line but not yet in overbought territory, suggests that there might be more room for upward movement before the asset becomes overextended.
As Ethereum tests this local resistance, the cryptocurrency community is eagerly anticipating regulatory decisions that could impact the broader market. One of the main catalysts for Ethereum, and indeed the wider cryptocurrency market, is the potential approval of a spot Ethereum ETF or a Bitcoin spot ETF.
The approval of a spot ETF has been a long-awaited event within the sector. An ETF, or Exchange-Traded Fund, allows investors to buy shares that represent the value of the underlying asset, in this case, Ethereum, without the need to hold the cryptocurrency itself. This eases entry for investors who are interested in the asset class but are hesitant to deal with the complexities of cryptocurrency ownership, storage and security.
As Ethereum hovers near this resistance level, market observers are monitoring the asset's ability to maintain its upward trajectory and break through the $2,400 price point. A successful breach of this level could pave the way for further gains, possibly leading toward the $2,500 mark.
Cardano finally broke through
Cardano has often been described as a project that moves cautiously, lagging behind the market, but the most recent breakthrough could be an indication of an upcoming disruptive performance.
The chart suggests that Cardano has reached a pivotal point. After a period of consolidation, ADA's price appears to be making a decisive move. The formation of a converging pattern, typically indicative of a price breakout, can be seen. Notably, the price has pushed above the upper trend line of this pattern, hinting at a potential continuation of the rally.

Analyzing the moving averages, we notice a bullish setup, with the price trading above the 50-day and 200-day moving averages. This is often interpreted as a positive signal, as it reflects a strong underlying trend with sustained buying interest. The gap between the moving averages and the current price also adds to this bullish narrative.
The volume bars do not show a substantial increase, suggesting that the breakout might not have fully captured the market's attention yet. A rise in trading volume would typically confirm a breakout, indicating increased conviction among traders.
Solana's ability to continue
Solana (SOL) has experienced a remarkable market run, capturing the attention of the cryptocurrency community. As the asset continues to gain traction, analysts and investors closely observe its price action for signs of sustainability or reversal. Currently, Solana shows signs that the tide may be turning, with a critical pattern emerging on its chart.
The price movement has recently formed what is known as a lower high, often interpreted as one of the initial indicators of a potential correction. This technical pattern occurs when the price peaks at a level lower than the previous high, signaling a decrease in the momentum that has been driving the bull market.
The significance of the lower high is underscored when placed within the context of the asset's recent performance. While the overall trajectory for Solana has been upward, this development suggests that traders and investors might be becoming more cautious, potentially leading to a shift in market sentiment.
Volume, a key factor in confirming trend reversals, appears to have lessened as the lower high formed, which may indicate a reduction in buying pressure. Additionally, the Relative Strength Index (RSI), while still at a relatively high level, has begun to show divergence, indicating a weakening in the current trend's strength.
 Dan Burgin
 U.Today Editorial Team
 Vladislav Sopov