

Disclaimer: The opinions expressed by our writers are their own and do not represent the views of U.Today. The financial and market information provided on U.Today is intended for informational purposes only. U.Today is not liable for any financial losses incurred while trading cryptocurrencies. Conduct your own research by contacting financial experts before making any investment decisions. We believe that all content is accurate as of the date of publication, but certain offers mentioned may no longer be available.

After a strong recovery impulse that momentarily raised the token above the local resistance cluster, Shiba Inu is making an effort to stabilize. Trading volume increased significantly as a result of the rally, but buyers soon faced selling pressure, which caused the daily high to be rejected.
What's happening with SHIB?
Technically, the asset is still below the 200-day and 100-day moving averages, which continue to characterize the general bearish trend. The first significant obstacle is the 50-day moving average, which is currently positioned nearly precisely at the $0.00000500 area.
After the recent spike, the shorter-term moving averages have already begun to rise, indicating strengthening momentum. Additionally, the RSI has rebounded to about the 58 level, providing space for a further increase before going into overbought territory.
This suggests that buyers will benefit in the near future, even though the momentum is not yet strong enough to support a more significant trend reversal. The important factor is still volume.
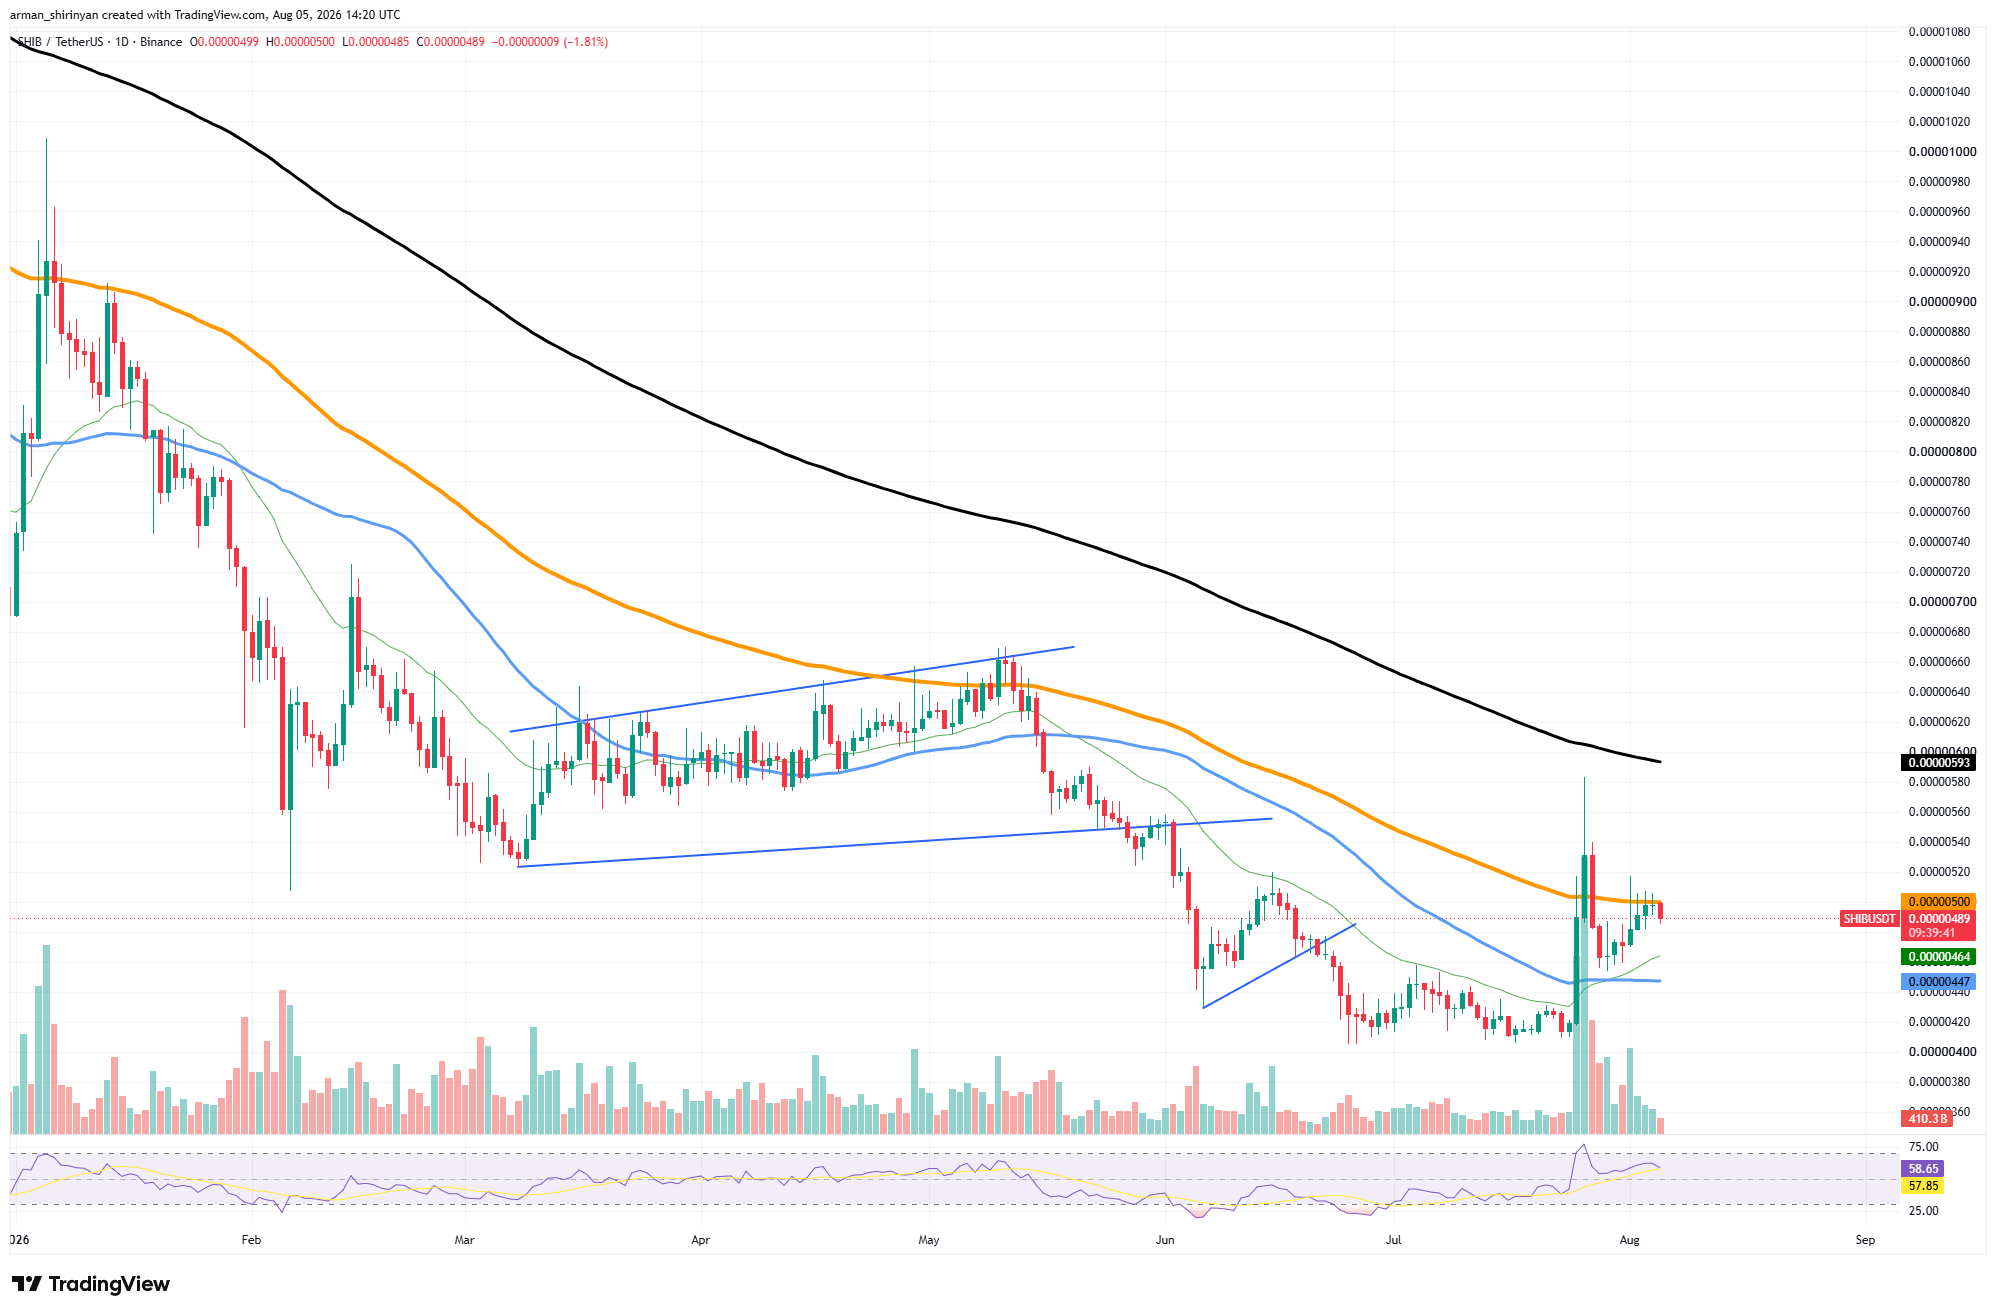
Although a significant number of people participated in the explosive breakout candle, turnover has been steadily decreasing in the subsequent sessions.
That pattern frequently indicates that traders are holding off on making further capital commitments until they have confirmation. In the absence of fresh buying activity, SHIB might keep moving sideways below resistance.
The first support on the decline is the region between $0.00000465 and $0.00000470, which is supported by the short-term moving average. The recent breakout zone around $0.00000440, where buyers had previously intervened forcefully, would be revealed if that level were lost. For the time being, it seems like SHIB is moving from an impulsive recovery to a consolidation phase.
While another rejection could prolong the wider downtrend that has persisted for the majority of 2026, a clear move above the 50-day moving average would probably shift sentiment toward a more forceful recovery attempt.
Near Protocol far from stabilization
Near Protocol is still under pressure even though it has recently corrected and is showing some signs of stabilization. The asset has begun to establish a base close to the $1.60 area after falling from its summer highs for a few weeks, but the overall technical picture still advises caution.
The fact that NEAR has dropped below every significant moving average is the worst part. A layered resistance structure is now formed by the 20-day, 50-day, 100-day, and even 200-day moving averages being above the current price.
Instead of signaling the start of a long-term recovery, this alignment usually indicates that the market is still in a corrective phase. After briefly testing support around $1.60, recent candles show that buyers were able to stop the immediate decline, resulting in a slight rebound.
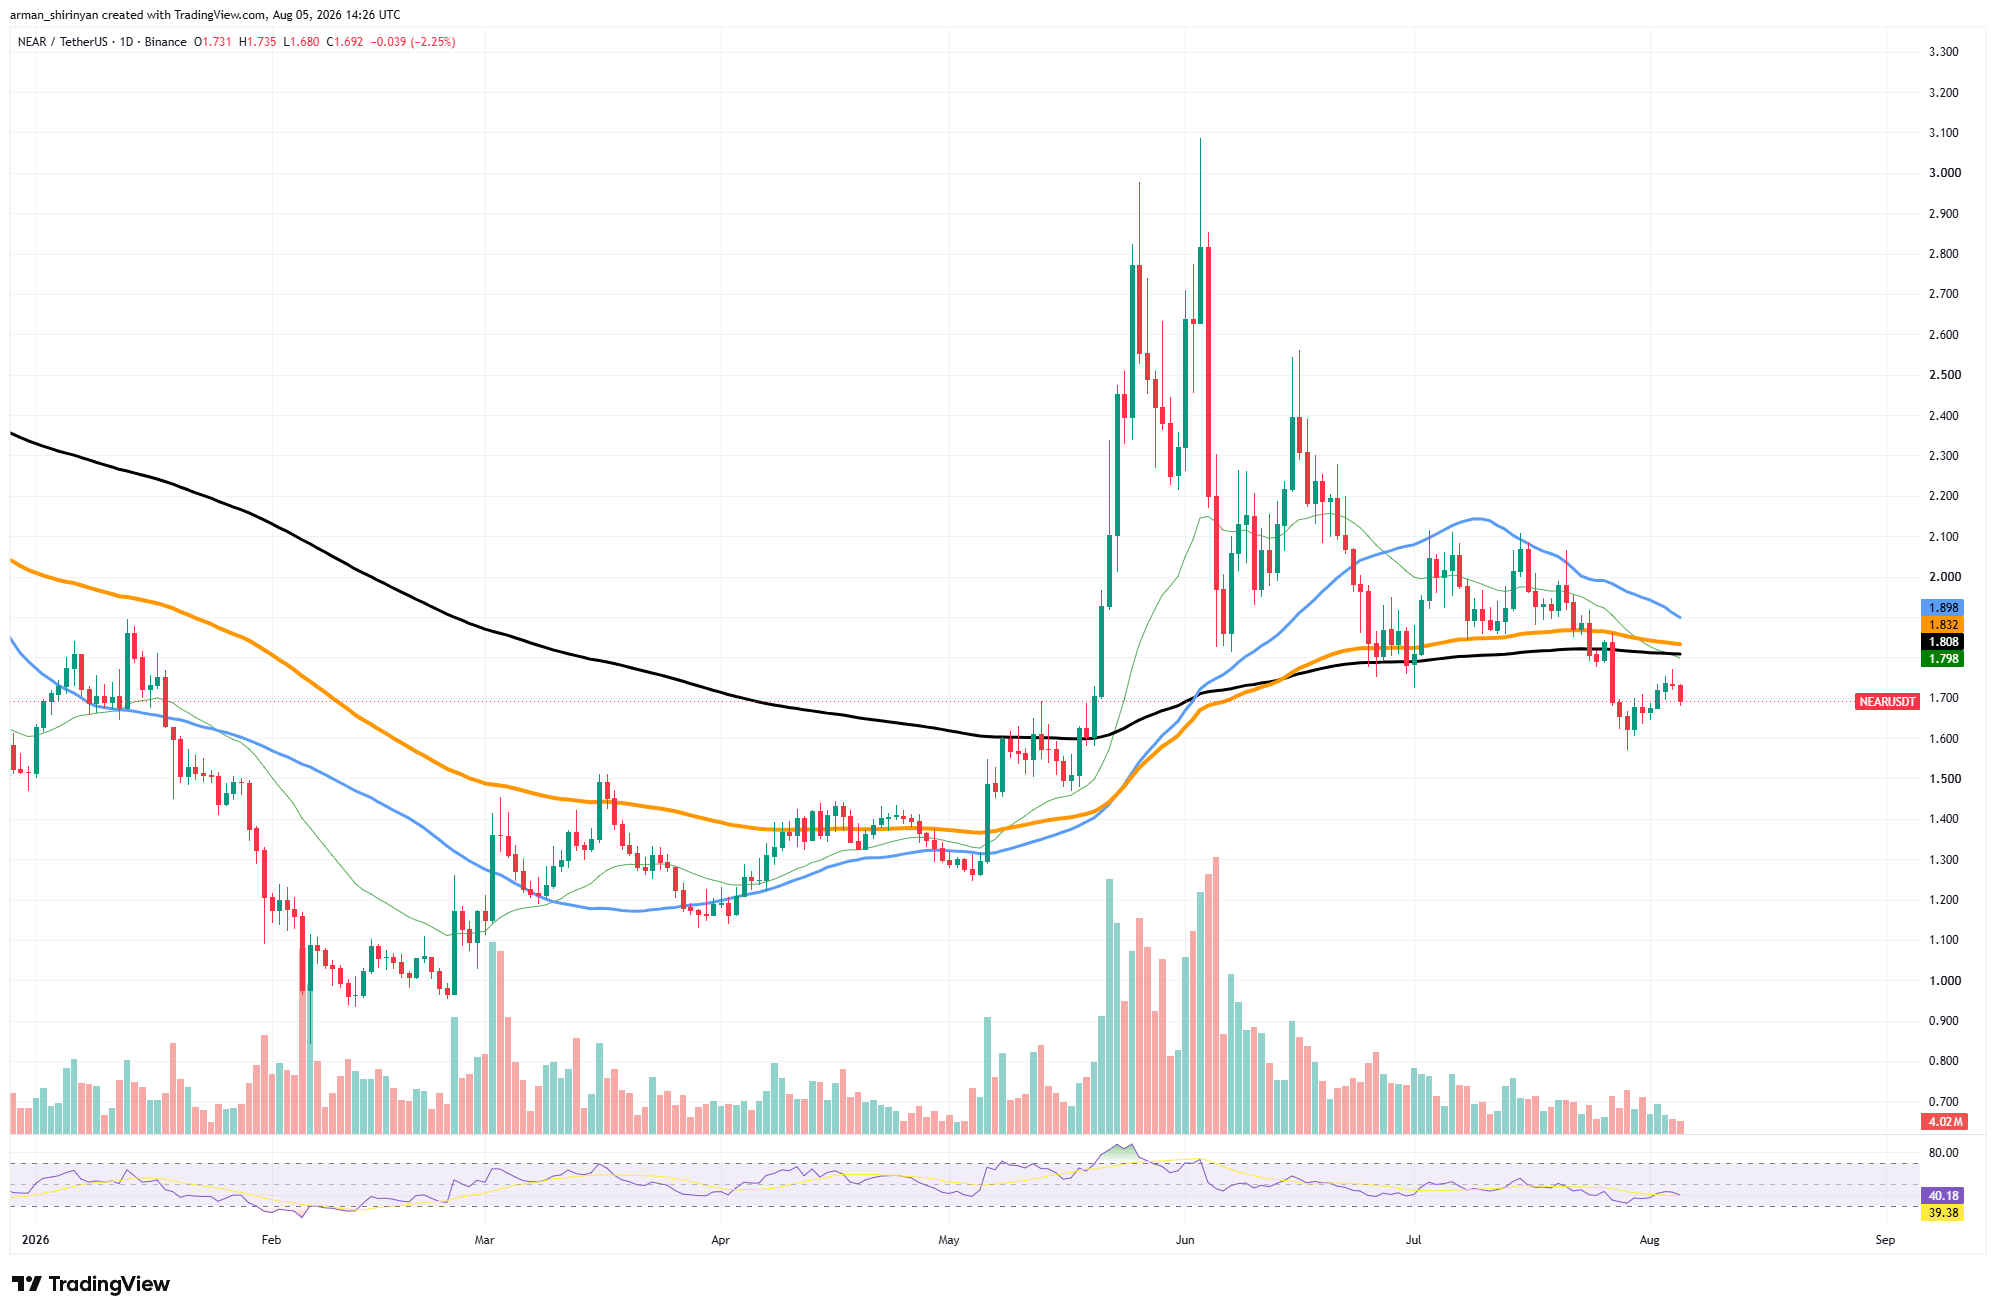
The lack of convincing volume in the recovery, however, indicates that institutional participation is still low. Rallies are likely to face selling interest at nearby resistance levels until more buying pressure appears. A similarly balanced picture is presented by momentum indicators.
Depending on the overall state of the market, this could result in either another leg lower or a gradual recovery. The 200-day moving average, which is close to $1.80, is the first barrier for bulls, and the 50-day average comes next. The technical outlook would improve if these levels were reclaimed, and traders might be inspired to aim for the 100-day moving average around $1.90.
The recent lows between $1.60 and $1.62 continue to be the center of support. A large portion of the summer advance could be erased if that zone fails and NEAR returns to lower price levels set prior to the May breakout.
Although NEAR is generally beginning to stabilize, there is still no indication on the chart that buyers have taken back control. Whether the current bounce turns into a larger trend reversal or just another brief relief rally will probably depend on whether the major moving averages are reclaimed.
Solana bounces back
After recovering from its June lows, Solana is still trading in a narrow consolidation range, but the technical picture is still unclear. Although the asset has stabilized in the $73–75 range, it still lacks the momentum necessary to escape the wider downtrend that has dominated the majority of 2026.
The convergence of the 20- and 50-day moving averages close to the current price is the most significant development. The fact that SOL is trading nearly exactly on top of both indicators indicates that neither buyers nor sellers have established definite control.
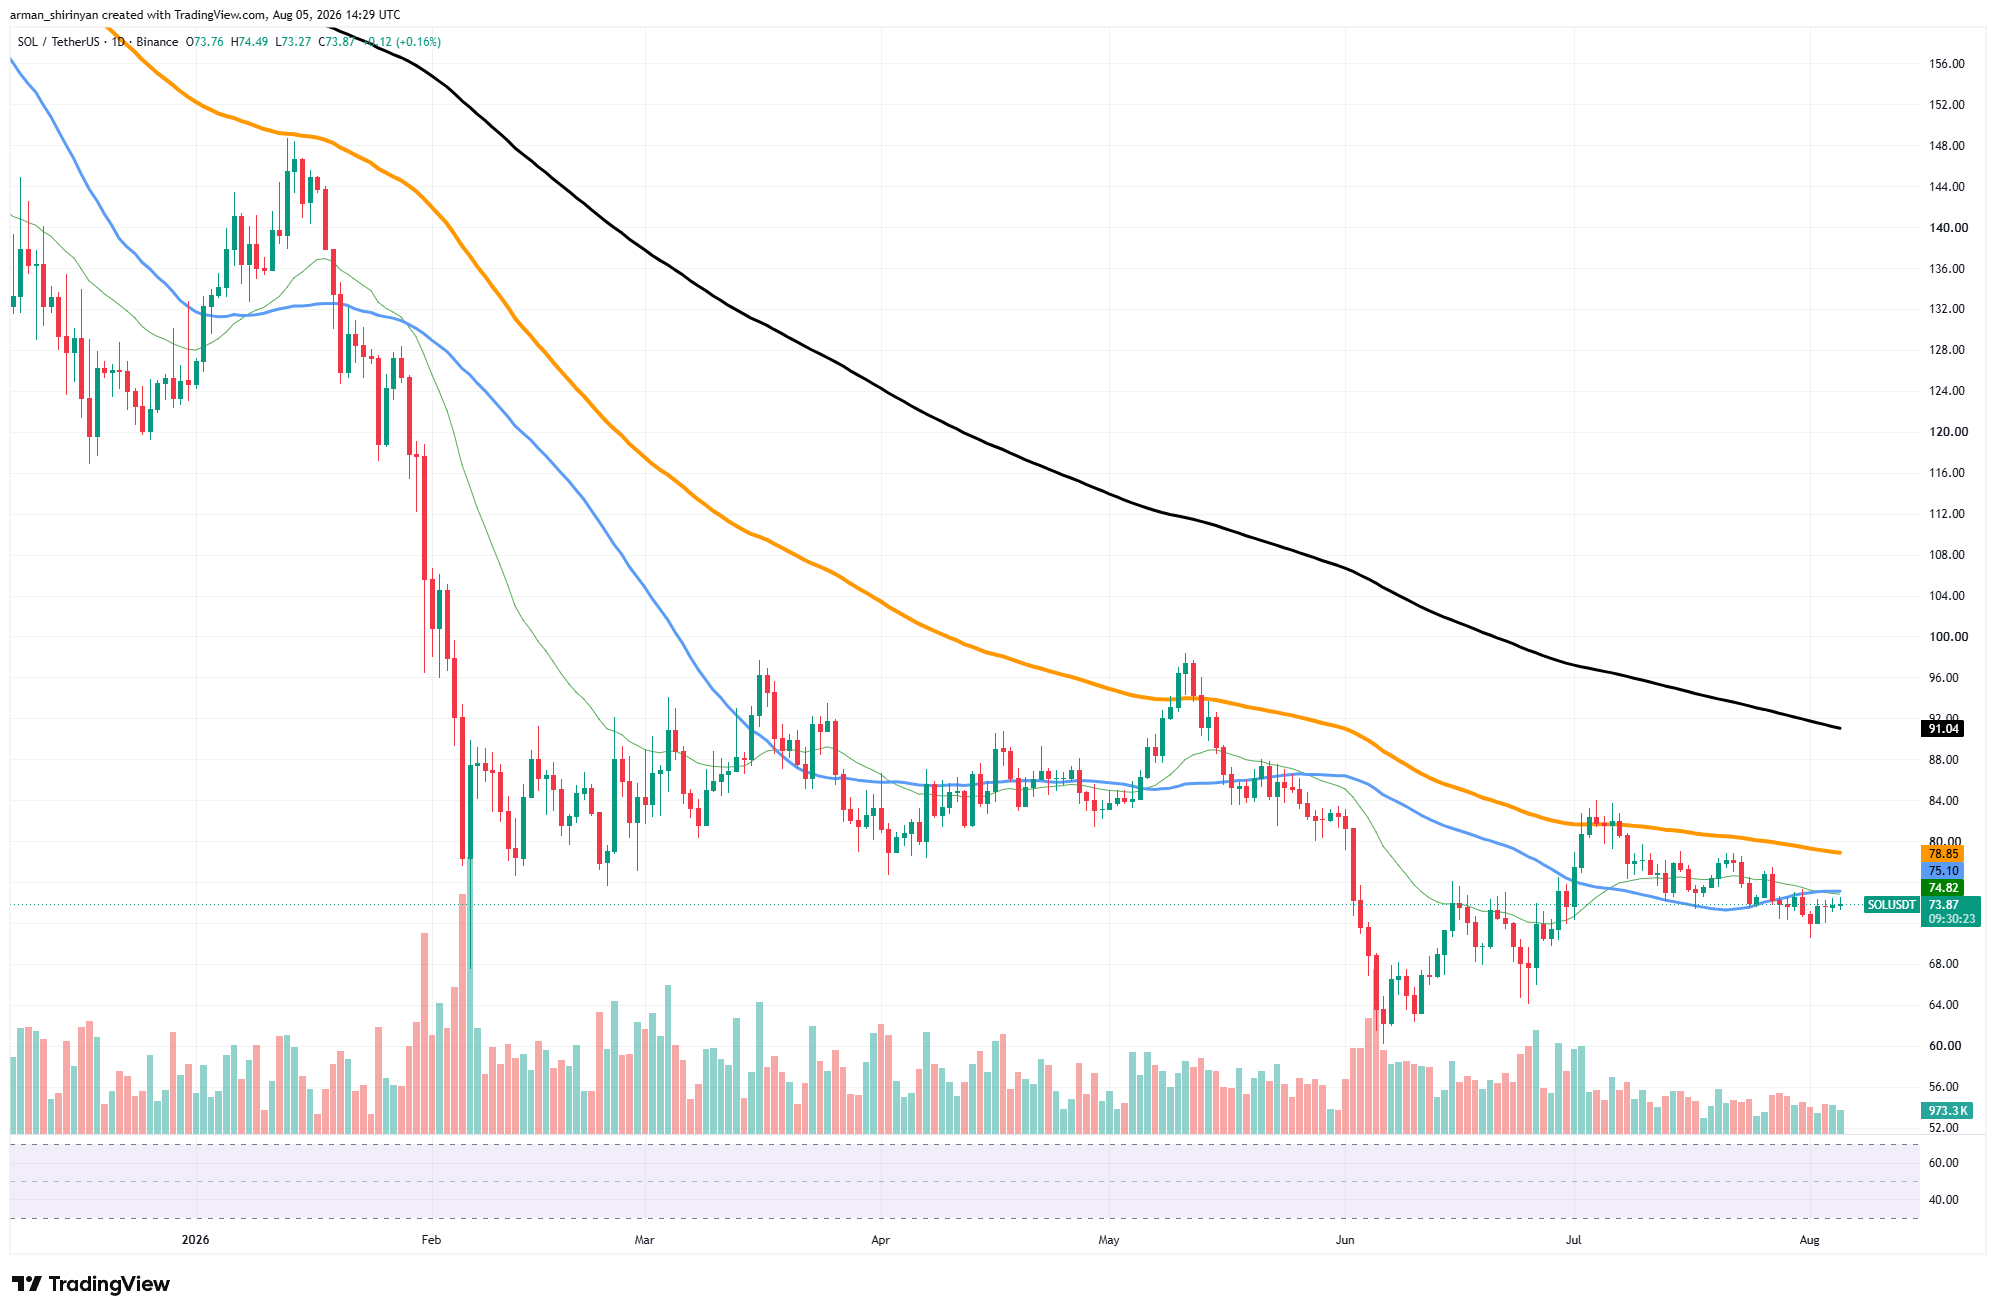
Instead of starting a verified recovery, this moving-average alignment indicates that Solana is moving from a corrective decline into a neutral phase. Bulls have prevented another move toward the annual bottom by successfully defending the higher low that was formed in June.
Nevertheless, they have consistently been unable to create sufficient buying pressure to reclaim higher resistance levels. Momentum indicators support that interpretation. The market is in a balanced state without significant bullish or bearish momentum, as evidenced by the RSI hovering around the midpoint near 45.
Additionally, volume has significantly decreased in recent weeks, suggesting that market participants are holding off on taking on larger positions until they have a catalyst.
The psychological $85 area would probably be the next upside target if buyers were successful in regaining the 100-day moving average around $79.
The medium-term outlook would be greatly enhanced by a move above that level, which would also highlight the 200-day average's decline. The short-term moving averages currently converge at $71–72, which continues to be the first support on the downside. If that region were lost, June's lows around $64 would be revealed, and the general bearish trend might resume.
After months of weakness, Solana seems to be building a base overall, though there is still no proof of this. The current structure favors ongoing consolidation over an abrupt trend reversal until price clearly breaks above the 100-day moving average with higher trading volume.
Cardano breaks out unexpectedly
Cardano broke above multiple important moving averages in a comparatively short amount of time, resulting in one of its strongest technical gains in weeks. The most recent surge has moved ADA closer to the $0.20 area, enabling it to overcome the resistance that had stopped all attempts at recovery since late May.
In contrast to numerous other large-cap altcoins, ADA has already reclaimed its 20-day and 50-day moving averages. The most crucial technical barrier before a more significant recovery can occur is the declining 100-day moving average, which the asset is currently testing close to $0.197.
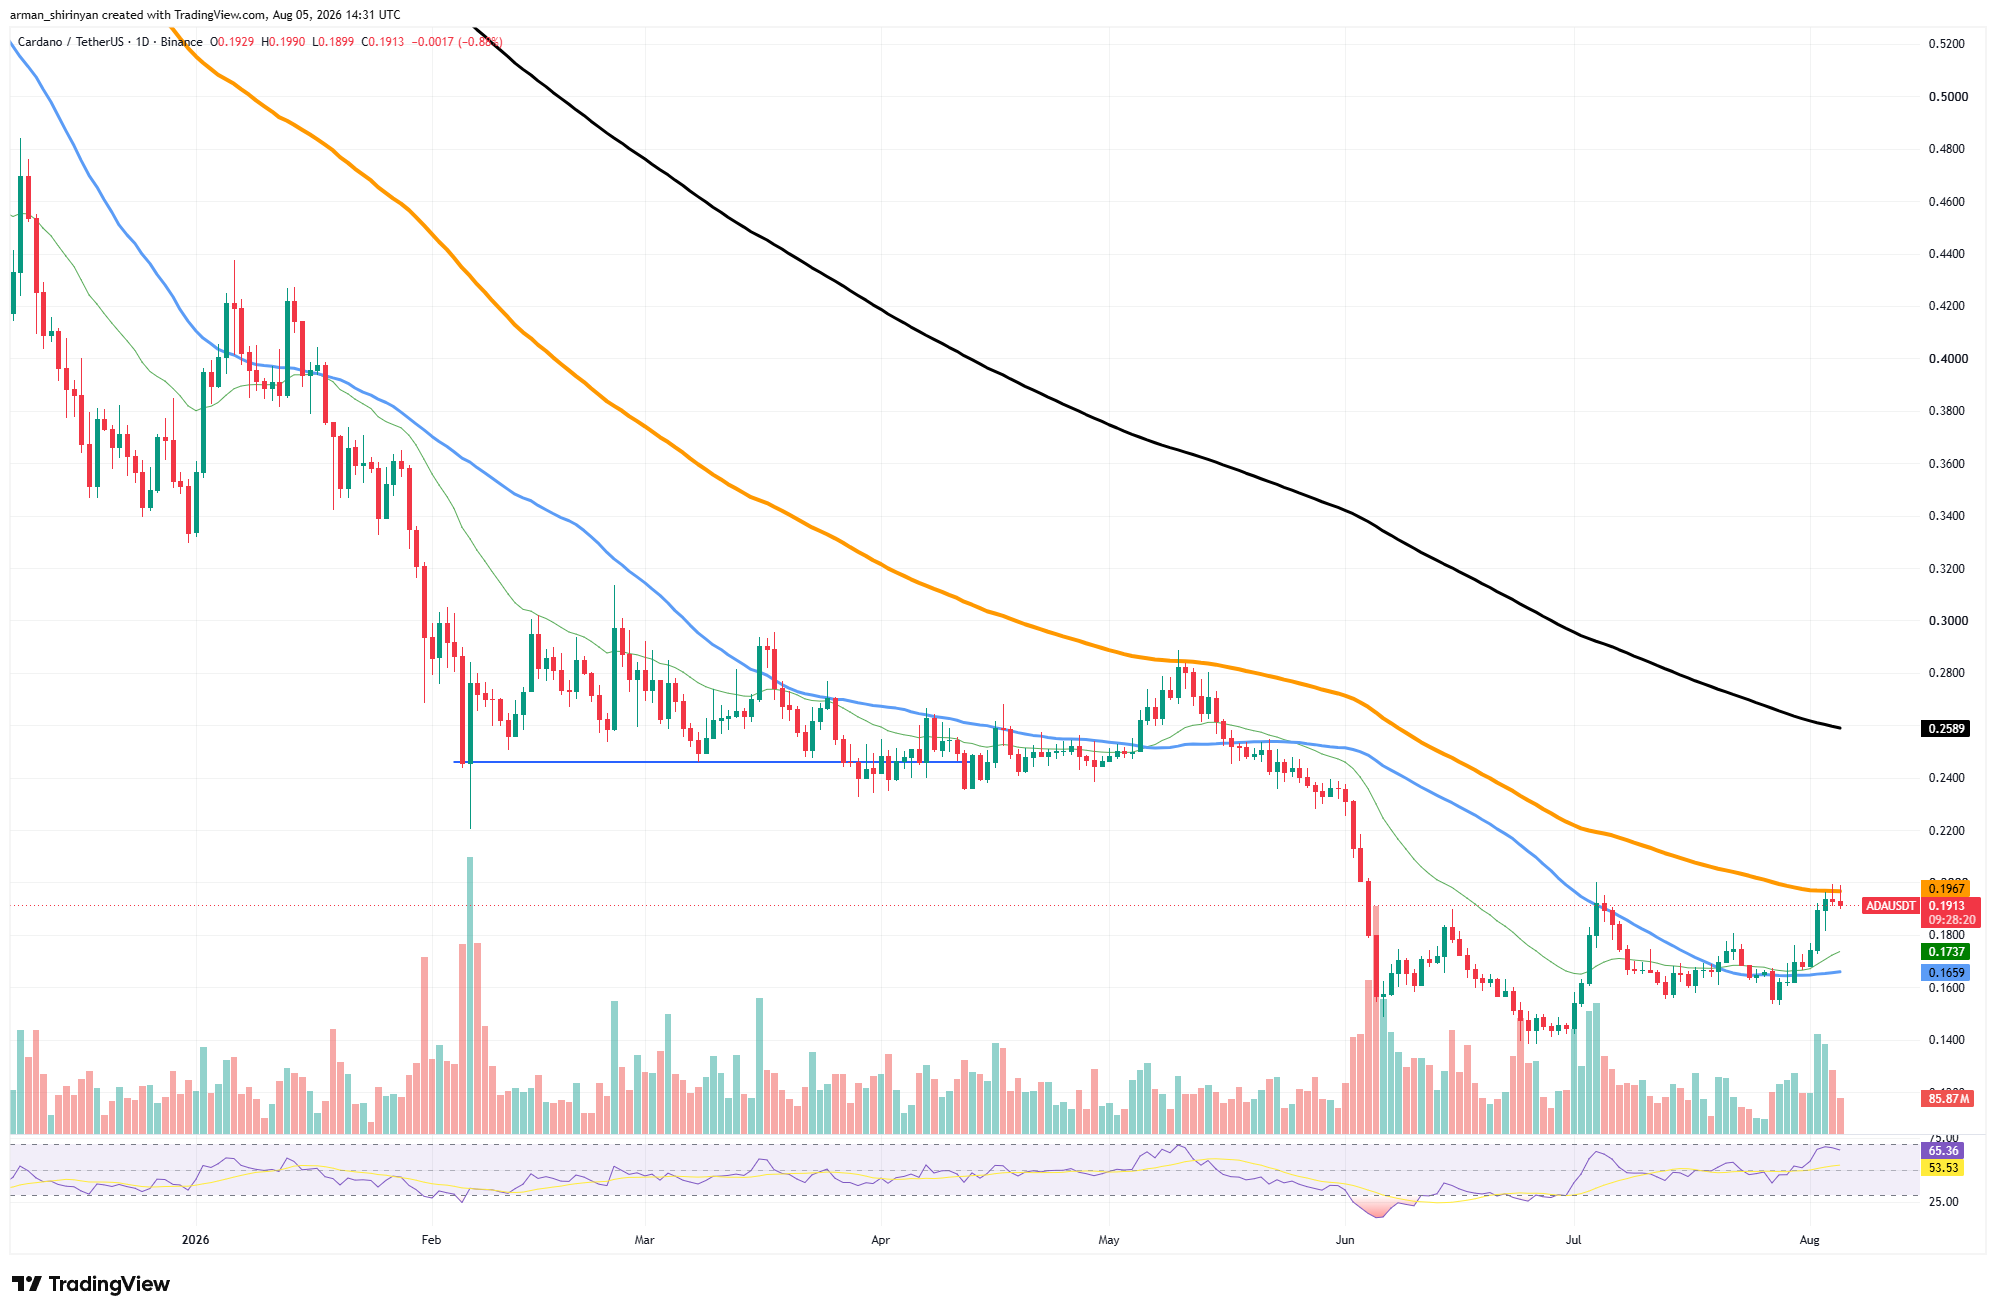
A significant increase in trading volume coincided with the breakout, indicating that buyers were involved in the move rather than short covering being the only factor driving the rally. As long as ADA stays above the recently reclaimed moving averages, the overall structure is still positive even though the most recent candle exhibits some hesitation beneath resistance.
Additionally, momentum has grown significantly. The fact that the RSI has risen above 65 suggests that bullish momentum has accelerated considerably. The indicator has not yet reached extreme levels that would automatically indicate exhaustion, even though it is approaching overbought territory.
Elevated RSI readings are frequently maintained for long stretches of time by strong trends. The 50-day moving average, which is currently close to $0.18, serves as the first support, and the rising 20-day average, which is close to $0.17, follows. The series of higher lows that have begun to appear over the last few weeks would be preserved if these levels were held.
 U.Today Editorial Team
 Dan Burgin
