

Disclaimer: The opinions expressed by our writers are their own and do not represent the views of U.Today. The financial and market information provided on U.Today is intended for informational purposes only. U.Today is not liable for any financial losses incurred while trading cryptocurrencies. Conduct your own research by contacting financial experts before making any investment decisions. We believe that all content is accurate as of the date of publication, but certain offers mentioned may no longer be available.

With few indications that a significant reversal is taking place, Dogecoin is still struggling within a well-established downtrend. Following months of price declines, DOGE is currently trading close to $0.070, staying below all of the daily chart's major moving averages. Although the asset has stabilized since its June sell-off, this has not resulted in a resurgence of bullish momentum on its own.
Multiple resistance layers
The technical framework is still inadequate. There are several layers of resistance between $0.075 and $0.085 as the 50-day and 100-day EMAs continue to slope downward, while the 26-day EMA is slightly above the current price.
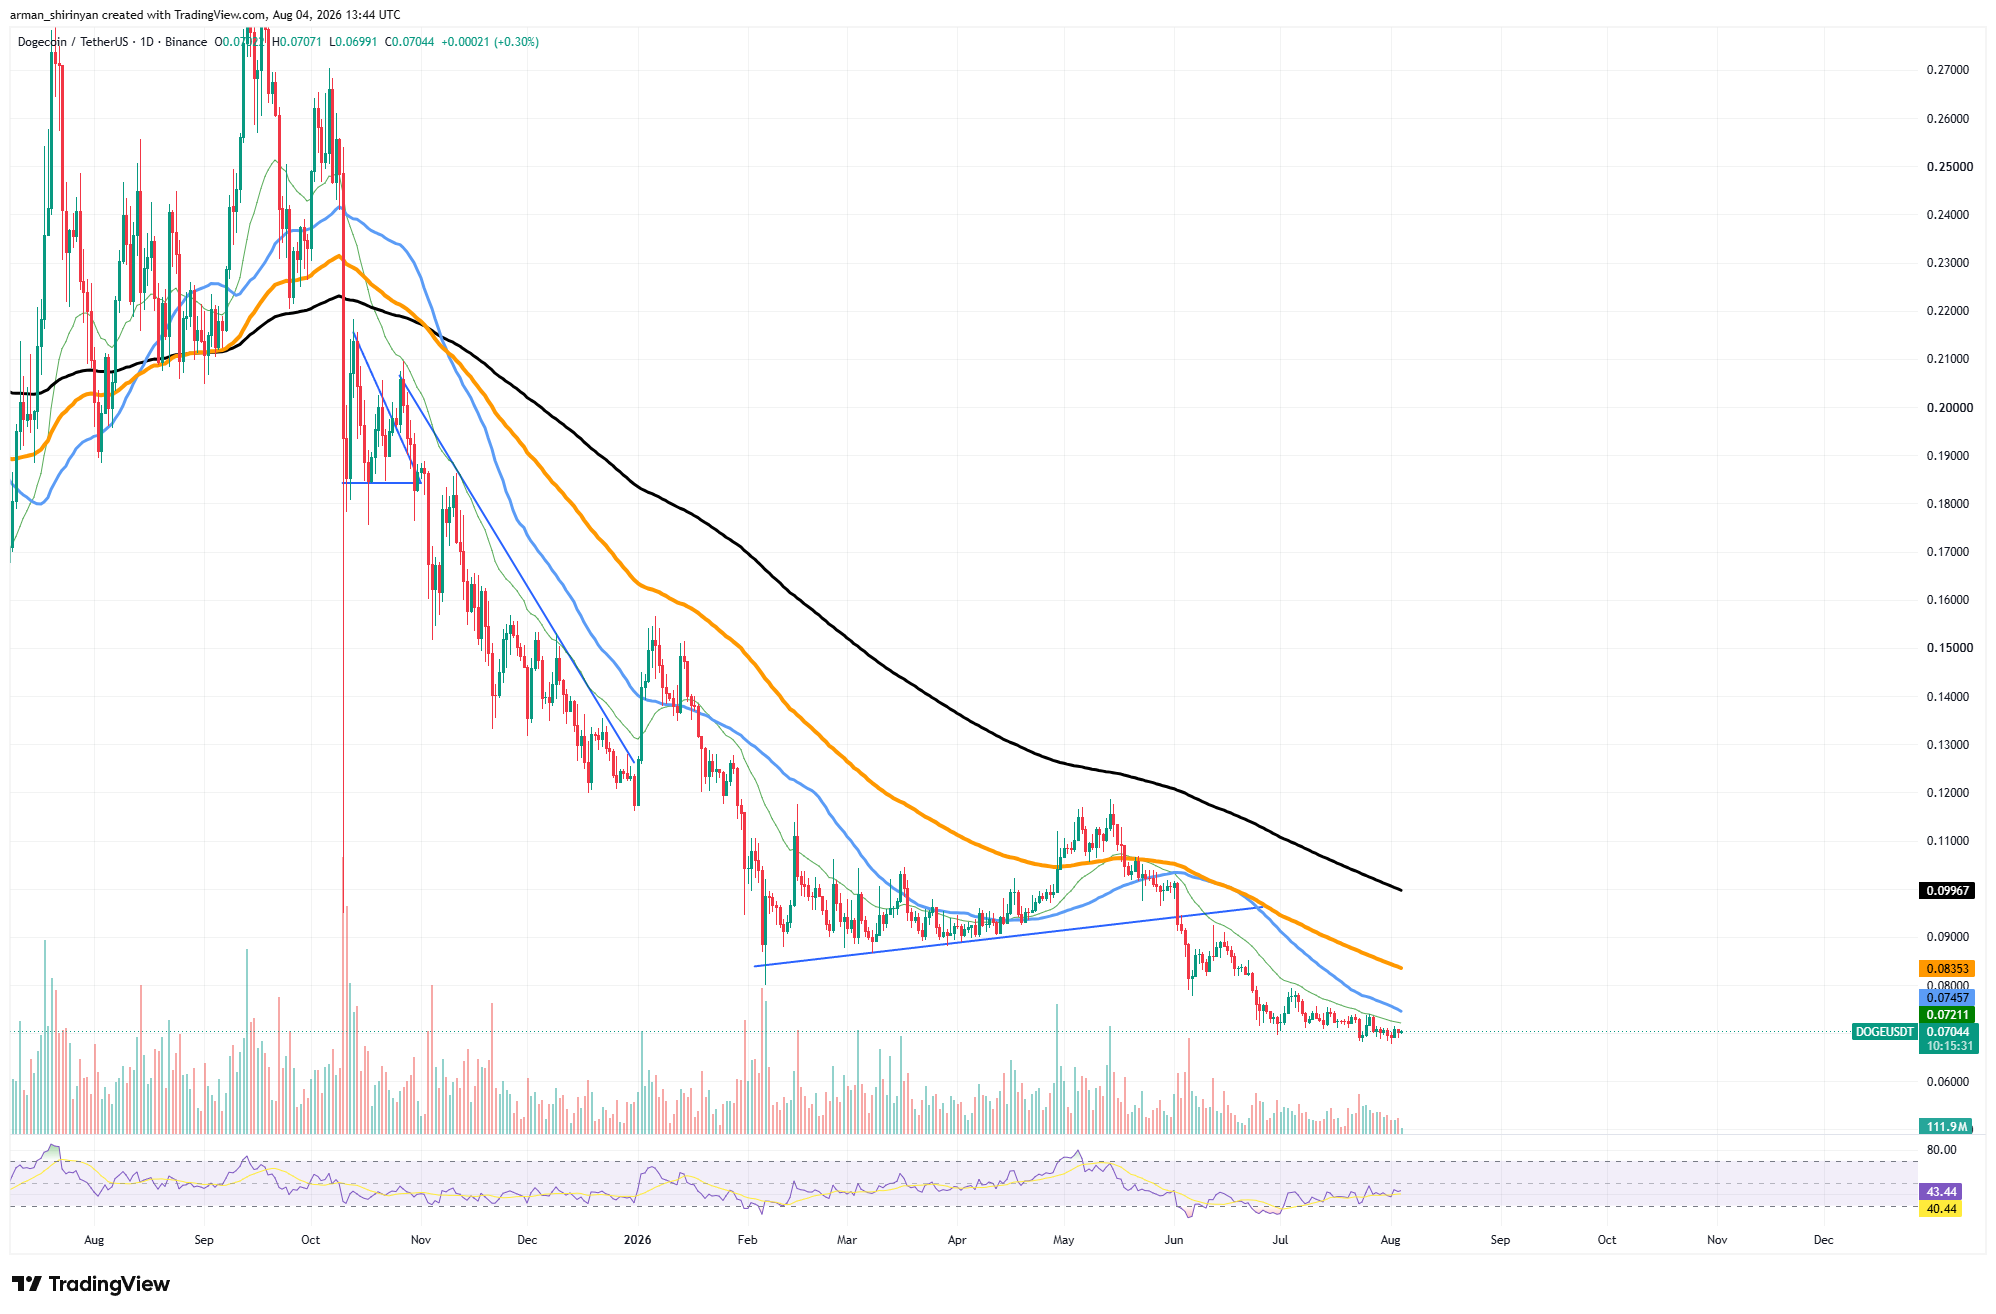
The distance DOGE would need to recover before the long-term trend could be deemed neutral once more is highlighted by the 200-day EMA, which is still much higher at $0.10.
Momentum indicators present a similarly cautious picture. The RSI, which is currently hovering around 44, has somewhat recovered from oversold territory, indicating that selling pressure has lessened but buyers have not yet gained control. Additionally, volume has been declining during the recent consolidation, suggesting that neither side is very convinced.
It's important to keep an eye on the $0.07 support zone. While regaining the 50-day EMA would be the first technical indication that bullish momentum is returning, a break below it might expose DOGE to another leg lower. Until then, Dogecoin is still stuck in a general bearish trend with low volatility.
XRP remains trapped
As buyers and sellers continue to compete around the $1.08 region, XRP is still trapped in consolidation. Although the asset has managed to avoid another breakdown below the psychologically significant $1 mark, each attempt at recovery has stalled below declining moving averages.
According to the chart, XRP is currently trading slightly below the 26-day and 50-day EMAs, with the 100-day EMA at $1.20 remaining the next significant barrier. The overall market structure has not yet changed in favor of bulls, as evidenced by the long-term 200-day EMA around $1.39, which is still trending lower. In contrast to earlier weeks, volatility has significantly decreased.
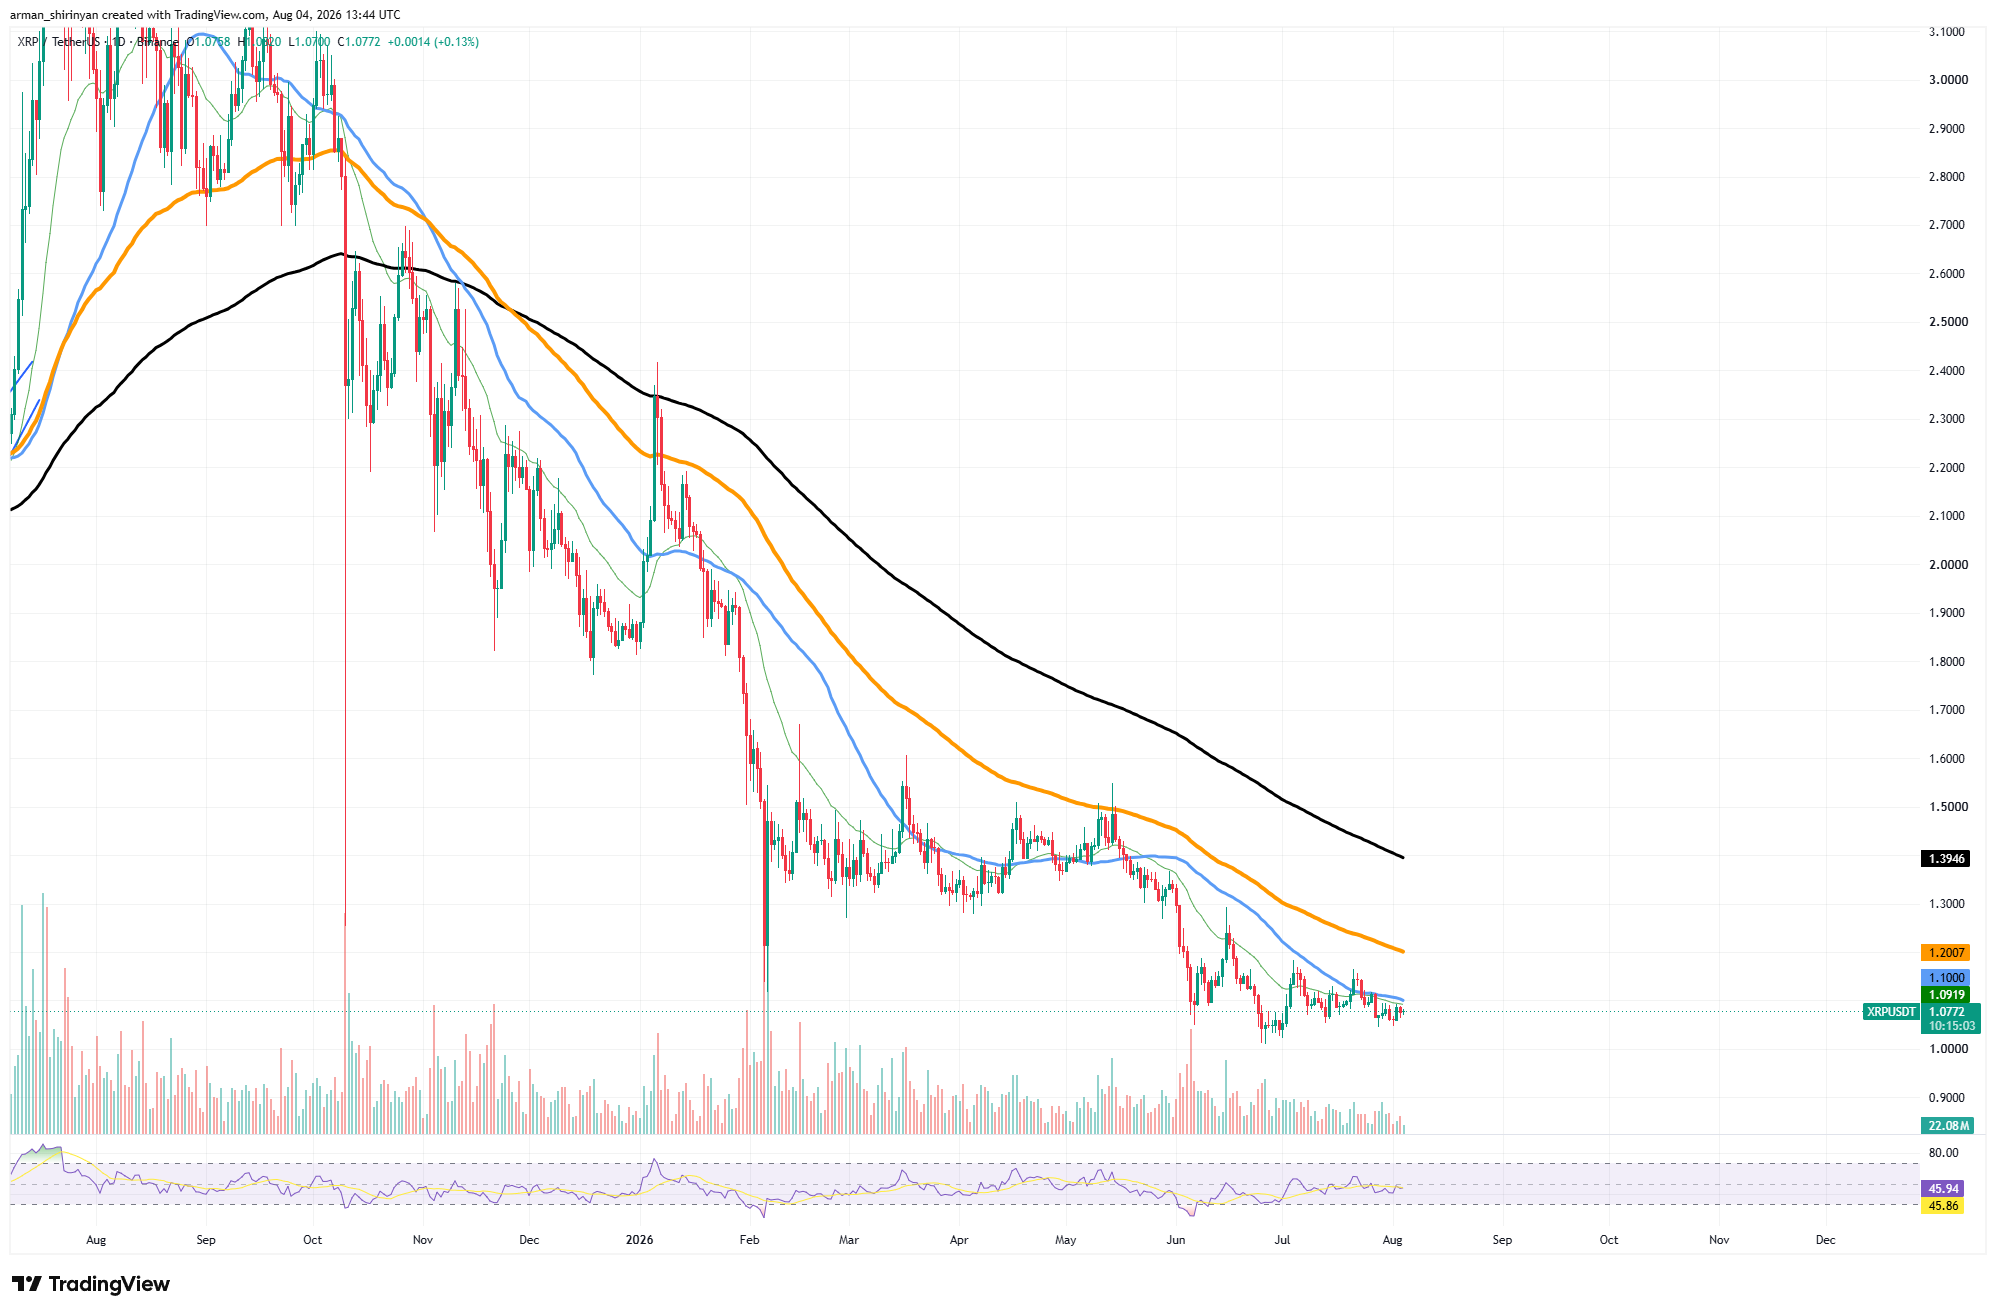
The fact that XRP is shifting within a progressively smaller range indicates that a more significant directional move might be imminent. The RSI is near 46, indicating balanced momentum where neither buyers nor sellers have a distinct advantage. The $1.00 psychological level continues to be the most crucial support.
Since June, bulls have defended that zone multiple times, but over time, repeated tests tend to erode support. The likelihood of a move toward the 100-day EMA would significantly rise if XRP were to recover the 50-day EMA and establish closes above $1.10.
On the other hand, losing $1 would probably increase selling pressure and render the current consolidation phase invalid. The market is currently waiting for a catalyst to identify XRP's next significant trend, so it is still range-bound.
Hyperliquid's stabilization is questioned
After one of its biggest corrections of the year, Hyperliquid is trying to stabilize. Before finding support around the 200-day exponential moving average near $50, the asset lost almost 30% in a few weeks after a rally that propelled HYPE above $75.
The significance of that long-term trend indicator has once again been demonstrated, leading to a recovery that has driven HYPE back toward $56. Although encouraging, the recovery process is still ongoing. HYPE is currently challenging the 50-day EMA at $58 after regaining the 26-day EMA.
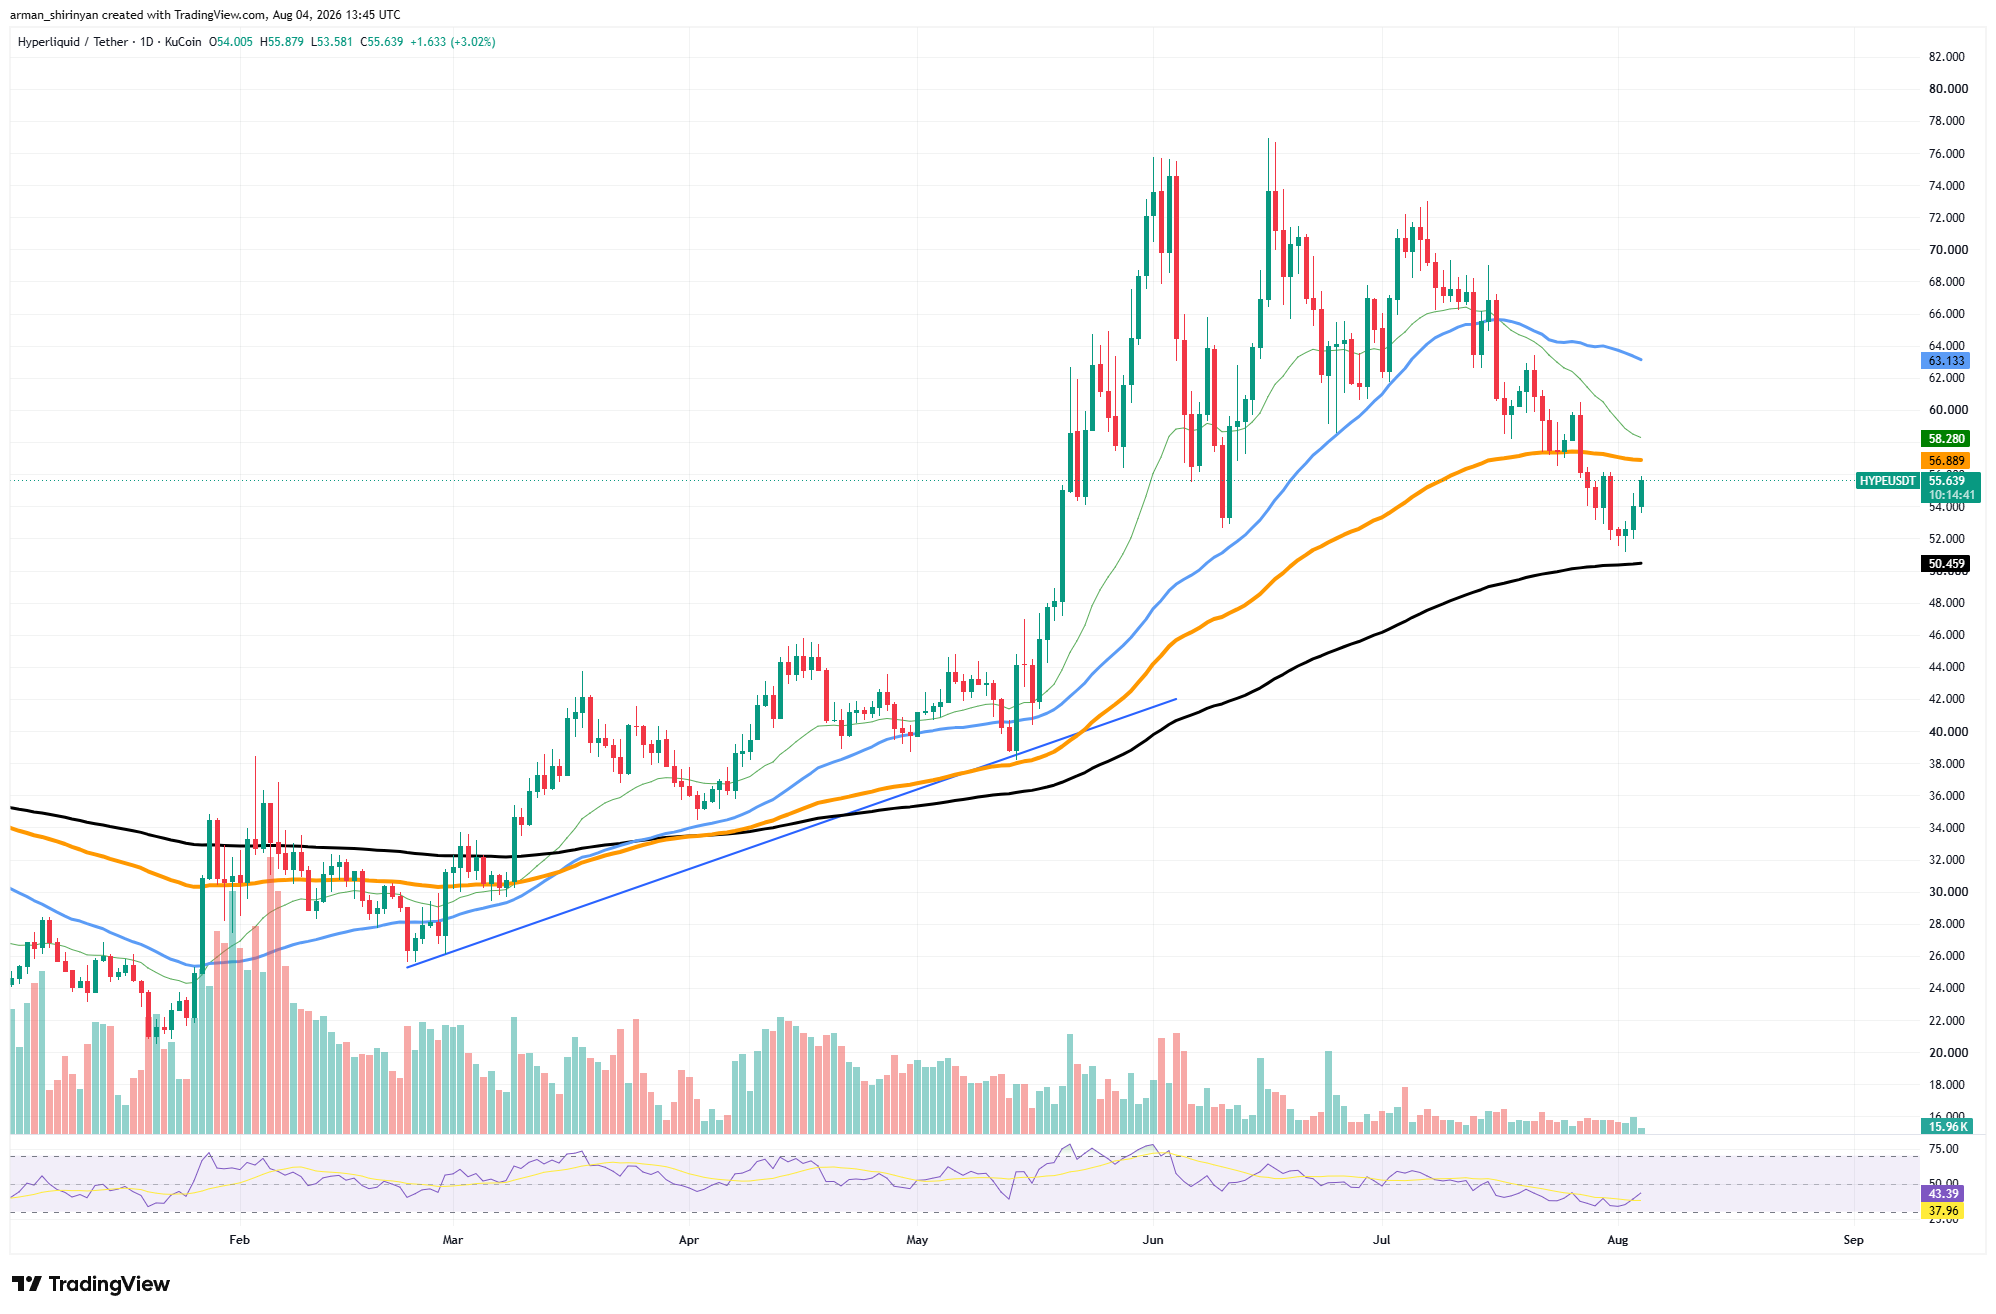
This moving average is the first significant obstacle for bulls because it aligns with a prior support area that became resistance following the July breakdown. Momentum remains mixed.
Although the Relative Strength Index has moved back from oversold territory, it is still below 50, suggesting that the bearish momentum has subsided without completely giving way to a bullish trend. During the recent rebound, trading volume also significantly decreased, indicating that buyers are returning cautiously rather than aggressively.

Whether HYPE can retake the $58-$60 range will determine the technical outlook. In the event of a successful breakout above the 50-day EMA, sellers are likely to resume their activity at the 100-day EMA, which is close to $63.
However, the likelihood of another retest of the 200-day EMA around $50 would rise if current levels were to fail. HYPE is still in a corrective phase until it starts generating higher highs above its medium-term moving averages, despite the recent rebound.
Bitcoin stuck in the key range
Bitcoin has recovered from its June decline and is still trading in a narrow consolidation range. The asset's price action is compressed between the 26-day and 50-day exponential moving averages, and it is currently trading at approximately $63,800. This indicates that the market has reached equilibrium but has not yet decided on its next course.
Every attempt at a recovery is still capped by the 50-day EMA at $67,000, while the 100-day and 200-day EMAs are still much higher, supporting the overall bearish trend. Bitcoin hasn't broken below $60,000 yet, but it hasn't gained enough momentum to overcome stronger resistance levels either.
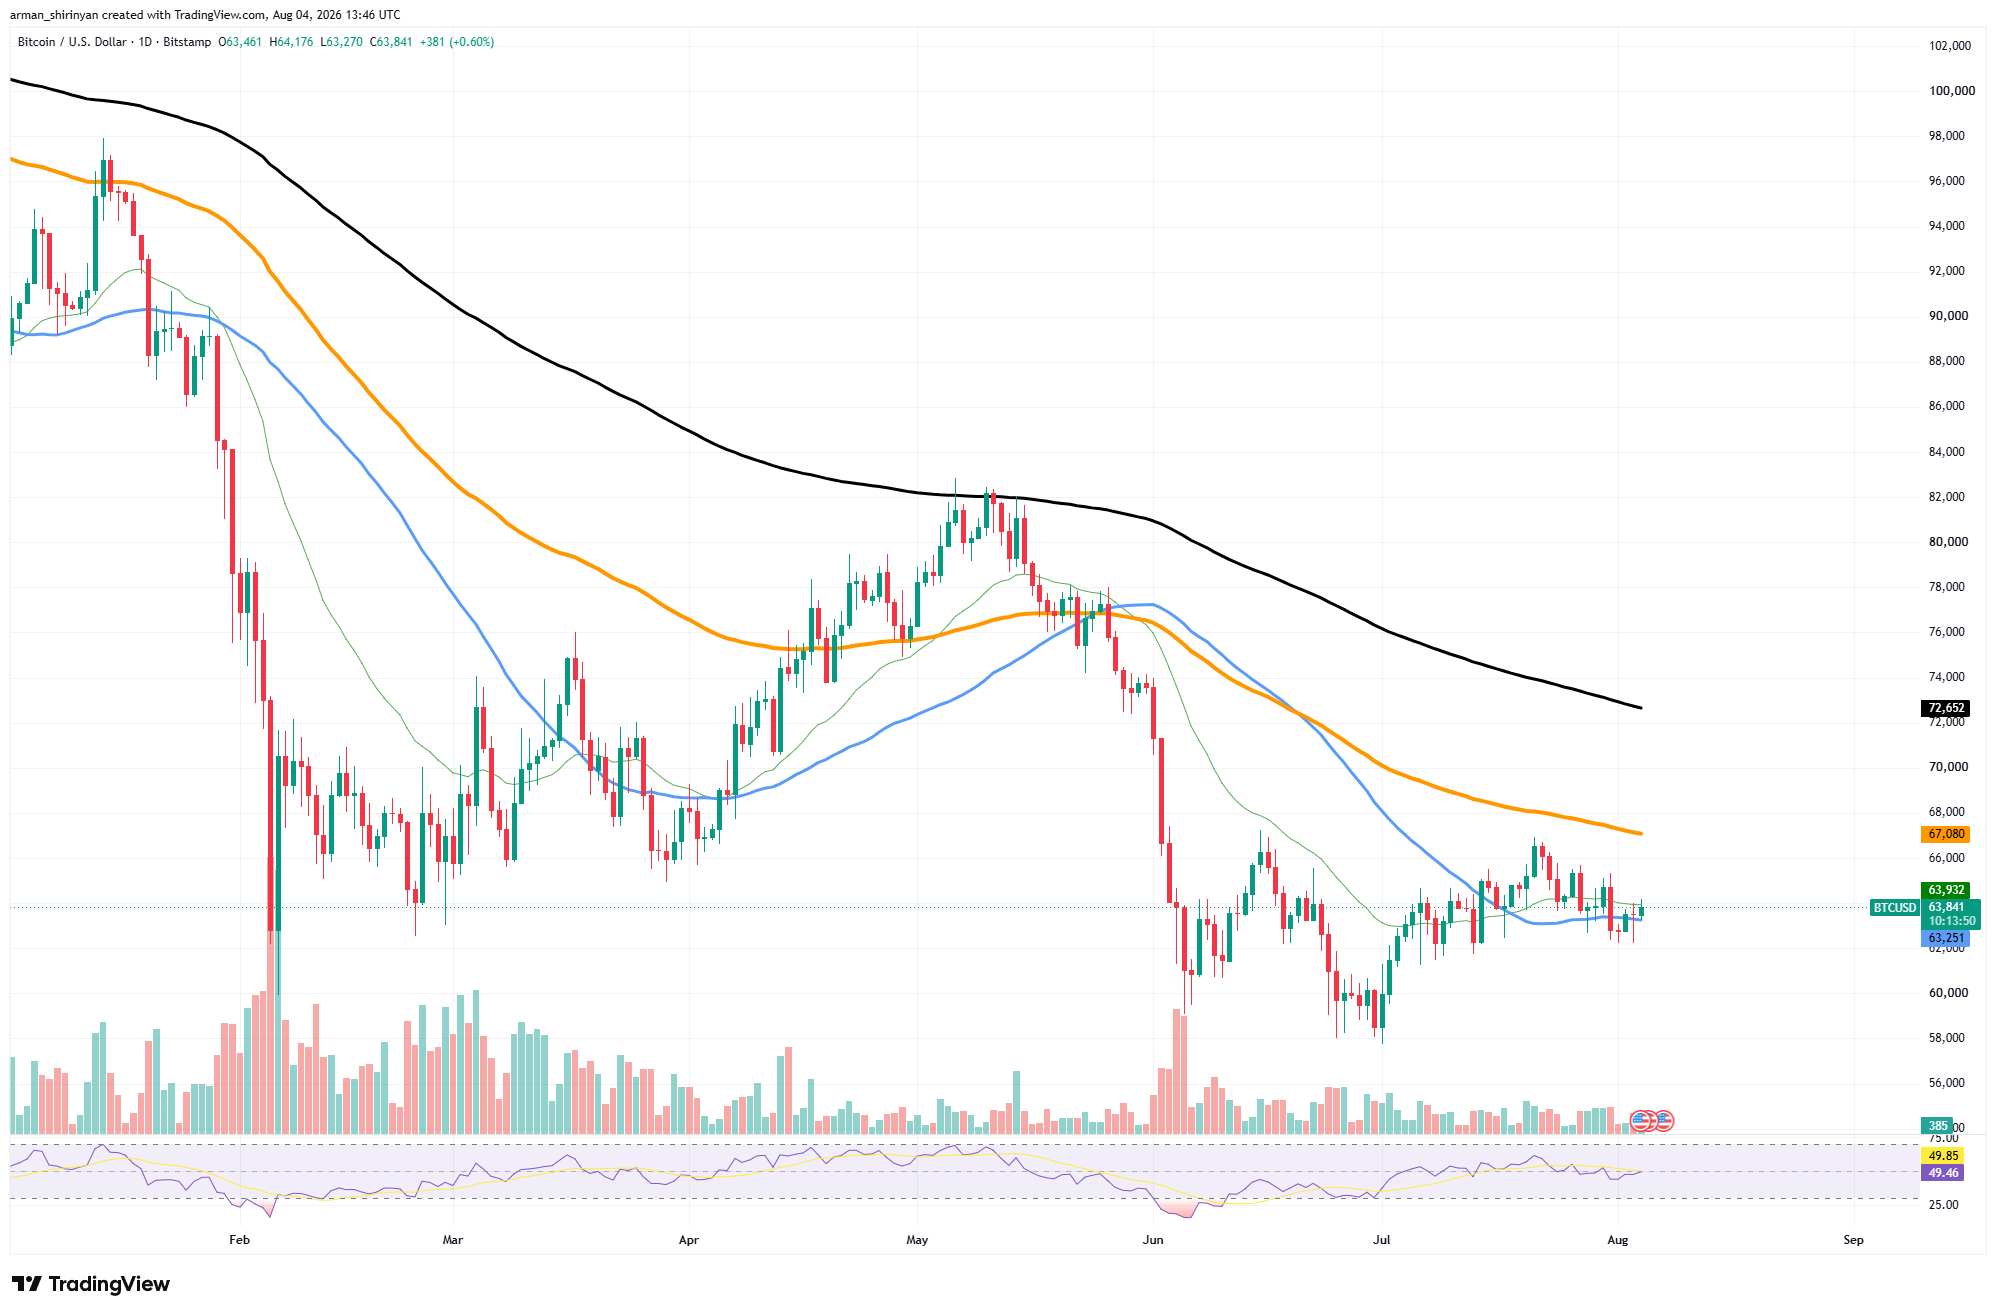
The lack of directional momentum is confirmed by the RSI, which is nearly exactly at 50. Trading volume has continued to decline during the recent sideways movement, and neither buyers nor sellers currently have a clear advantage.
When volatility returns, such conditions frequently precede a larger breakout. The 50-day EMA is the first significant barrier, while immediate support remains close to $60,000.
The technical outlook for Bitcoin would be enhanced by a clear move above that level, which might draw attention to the 100-day EMA around $72,000. Until then, the market is waiting for a catalyst that can end the current period of uncertainty, and Bitcoin is still range-bound.
 U.Today Editorial Team
 Dan Burgin
