
Disclaimer: The opinions expressed by our writers are their own and do not represent the views of U.Today. The financial and market information provided on U.Today is intended for informational purposes only. U.Today is not liable for any financial losses incurred while trading cryptocurrencies. Conduct your own research by contacting financial experts before making any investment decisions. We believe that all content is accurate as of the date of publication, but certain offers mentioned may no longer be available.
The current state of affairs on the cryptocurrency market can be certainly called "interesting," as we are witnessing a substantial outflow from various ETFs and descending volumes that hint at the end of the accumulation cycle.
Shiba Inu's biggest chance
Shiba Inu is displaying what could be its most significant bullish signal in months, and this signal is based on volume rather than price action alone. Long-term reversals are often built on a growing discrepancy between declining price action and rising volume dynamics, even though the overall market structure for SHIB is still clearly bearish. Until it is too late, most investors tend to ignore this signal, dismissing it because it does not immediately show up in the price.
With the 50-, 100- and 200-day moving averages serving as enduring resistance, SHIB remains stuck below all major daily moving averages. The trend is still downward from a structural standpoint, and recent attempts to break higher have failed without producing sustained momentum.
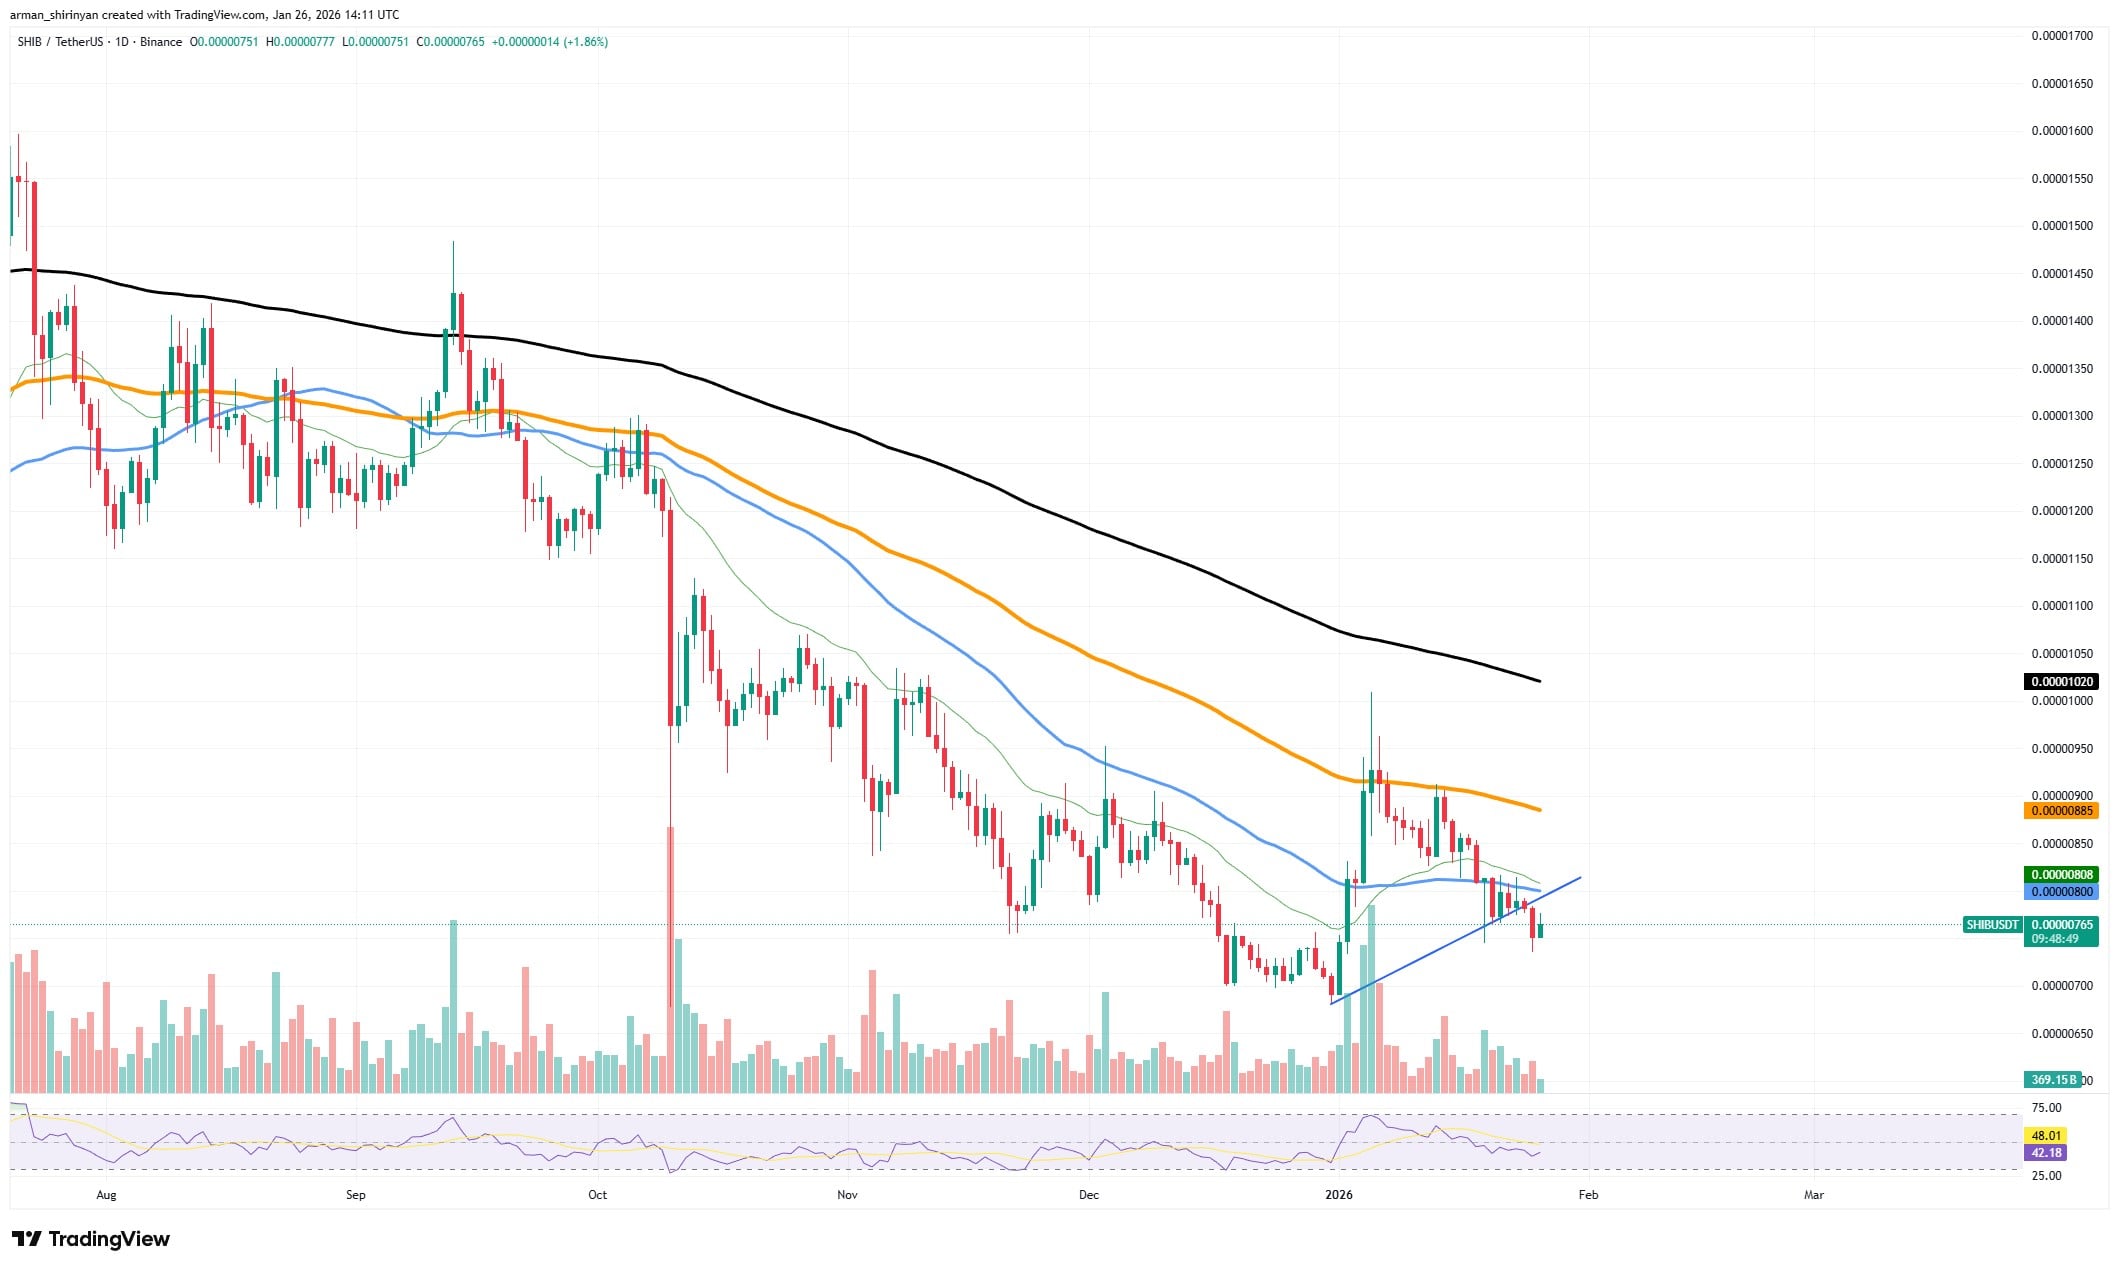
The story is told differently by volume, which is often ignored until after a reversal is already underway. Downside volume has not increased meaningfully during recent sell-offs and consolidations, suggesting a lack of urgency from sellers.
The price is still being pushed lower by bears, but their conviction appears to be weakening with each attempt. This view is supported by the recent ascending structure that developed despite the larger, clearly defined downtrend.

Even after SHIB broke down from its short-term wedge pattern, there was insufficient follow-through volume to confirm a strong bearish continuation. Strong bearish continuation does not look like this, especially on markets where sellers are confident and aggressive.
Instead, the behavior implies that supply is being absorbed rather than forcefully dumped, and that distribution is slowing rather than accelerating. The same underlying story is reinforced by RSI behavior.
Despite continued price weakness, momentum has recovered from extremely oversold conditions and is now stabilizing in a neutral zone, refusing to roll over aggressively. Rather than showing capitulation, this type of momentum behavior more commonly appears ahead of accumulation phases.
The main lesson is straightforward: pressure is weakening even while price remains weak.
Micro XRP death cross
Many traders are quick to call XRP’s recent printing a death cross, but the truth is far less dramatic than the phrase suggests. This crossover is not the traditional 50-day moving average crossing below the 200-day, which historically carries more weight.

Rather, it is a short-term, low-impact event that says very little about the long-term trajectory of XRP, specifically a 26 EMA crossing below the 50 EMA.
After weeks of relentless downward pressure, this micro death cross formed as a lagging confirmation of what the price had already done, not as a leading indicator. Since failing to maintain the $2.30-$2.40 range, XRP has been in a clear downward trend, and the short-term averages have simply followed the price going lower.
From a technical standpoint, XRP remains below all meaningful trend-defining averages. The broader bearish structure is reinforced by the 100 and 200 EMAs, both of which are still sloping downward and positioned well above the current price.
This interpretation is supported by volume behavior. Importantly, there was no increase in sell-side volume during the crossover itself. Participation is required for any significant trend shift, whether bullish or bearish, and volume remains subdued in this case. That alone undermines any attempt to frame this move as a decisive breakdown.
Ethereum diving into technicality
Ethereum is approaching a technical zone, where downside pressure appears to be running out. ETH is currently trading near $2,900 after weeks of relentless selling, with momentum indicators clearly signaling oversold conditions. The current setup suggests that Ethereum may be closer to a recovery phase than another leg down, even though the broader market trend remains precarious.
The Relative Strength Index (RSI) offers the most significant signal. On the daily time frame, RSI is struggling to move lower after already falling into oversold territory. Historically, this behavior has marked periods when sellers begin to lose control, even if a full trend reversal does not occur immediately. Oversold conditions do not guarantee a bottom, but they do indicate that the risk-reward for initiating new short positions is getting worse.

Price structure supports this interpretation. Ethereum has lost all major moving averages, including the 50-, 100- and 200-day lines, confirming a bearish medium-term trend. At the same time, this also suggests that substantial technical damage has already been done. Markets rarely move in straight lines, and after such a prolonged decline, stabilization or a relief bounce becomes the more probable near-term outcome.
This does not imply that Ethereum is starting a new bull market. Any near-term recovery would likely be corrective rather than impulsive, with the macro structure still firmly bearish. Significant resistance remains in the $3,200-$3,400 zone. Even so, a recovery attempt is the most realistic expectation given the oversold RSI, waning downside momentum and price proximity to historically reactive levels.
 Dan Burgin
 U.Today Editorial Team