Disclaimer: The opinions expressed by our writers are their own and do not represent the views of U.Today. The financial and market information provided on U.Today is intended for informational purposes only. U.Today is not liable for any financial losses incurred while trading cryptocurrencies. Conduct your own research by contacting financial experts before making any investment decisions. We believe that all content is accurate as of the date of publication, but certain offers mentioned may no longer be available.
Uptober continues with explosive rallies here and there: XRP is readying to break $3, Bitcoin is barely handling the enormous buying support it is facing and Shiba Inu might finally be ready for $0.00002.
XRP can smell $3
Right now, XRP is hovering just below $3, one of the most important resistance levels on its daily chart. Even though the asset has recovered from recent lows thanks to bullish momentum, the technical setup indicates that XRP may soon face a make-or-break moment. On the daily chart, short-term buyers are pushing the price toward the descending trendline resistance as XRP rises back above its 50-day EMA.
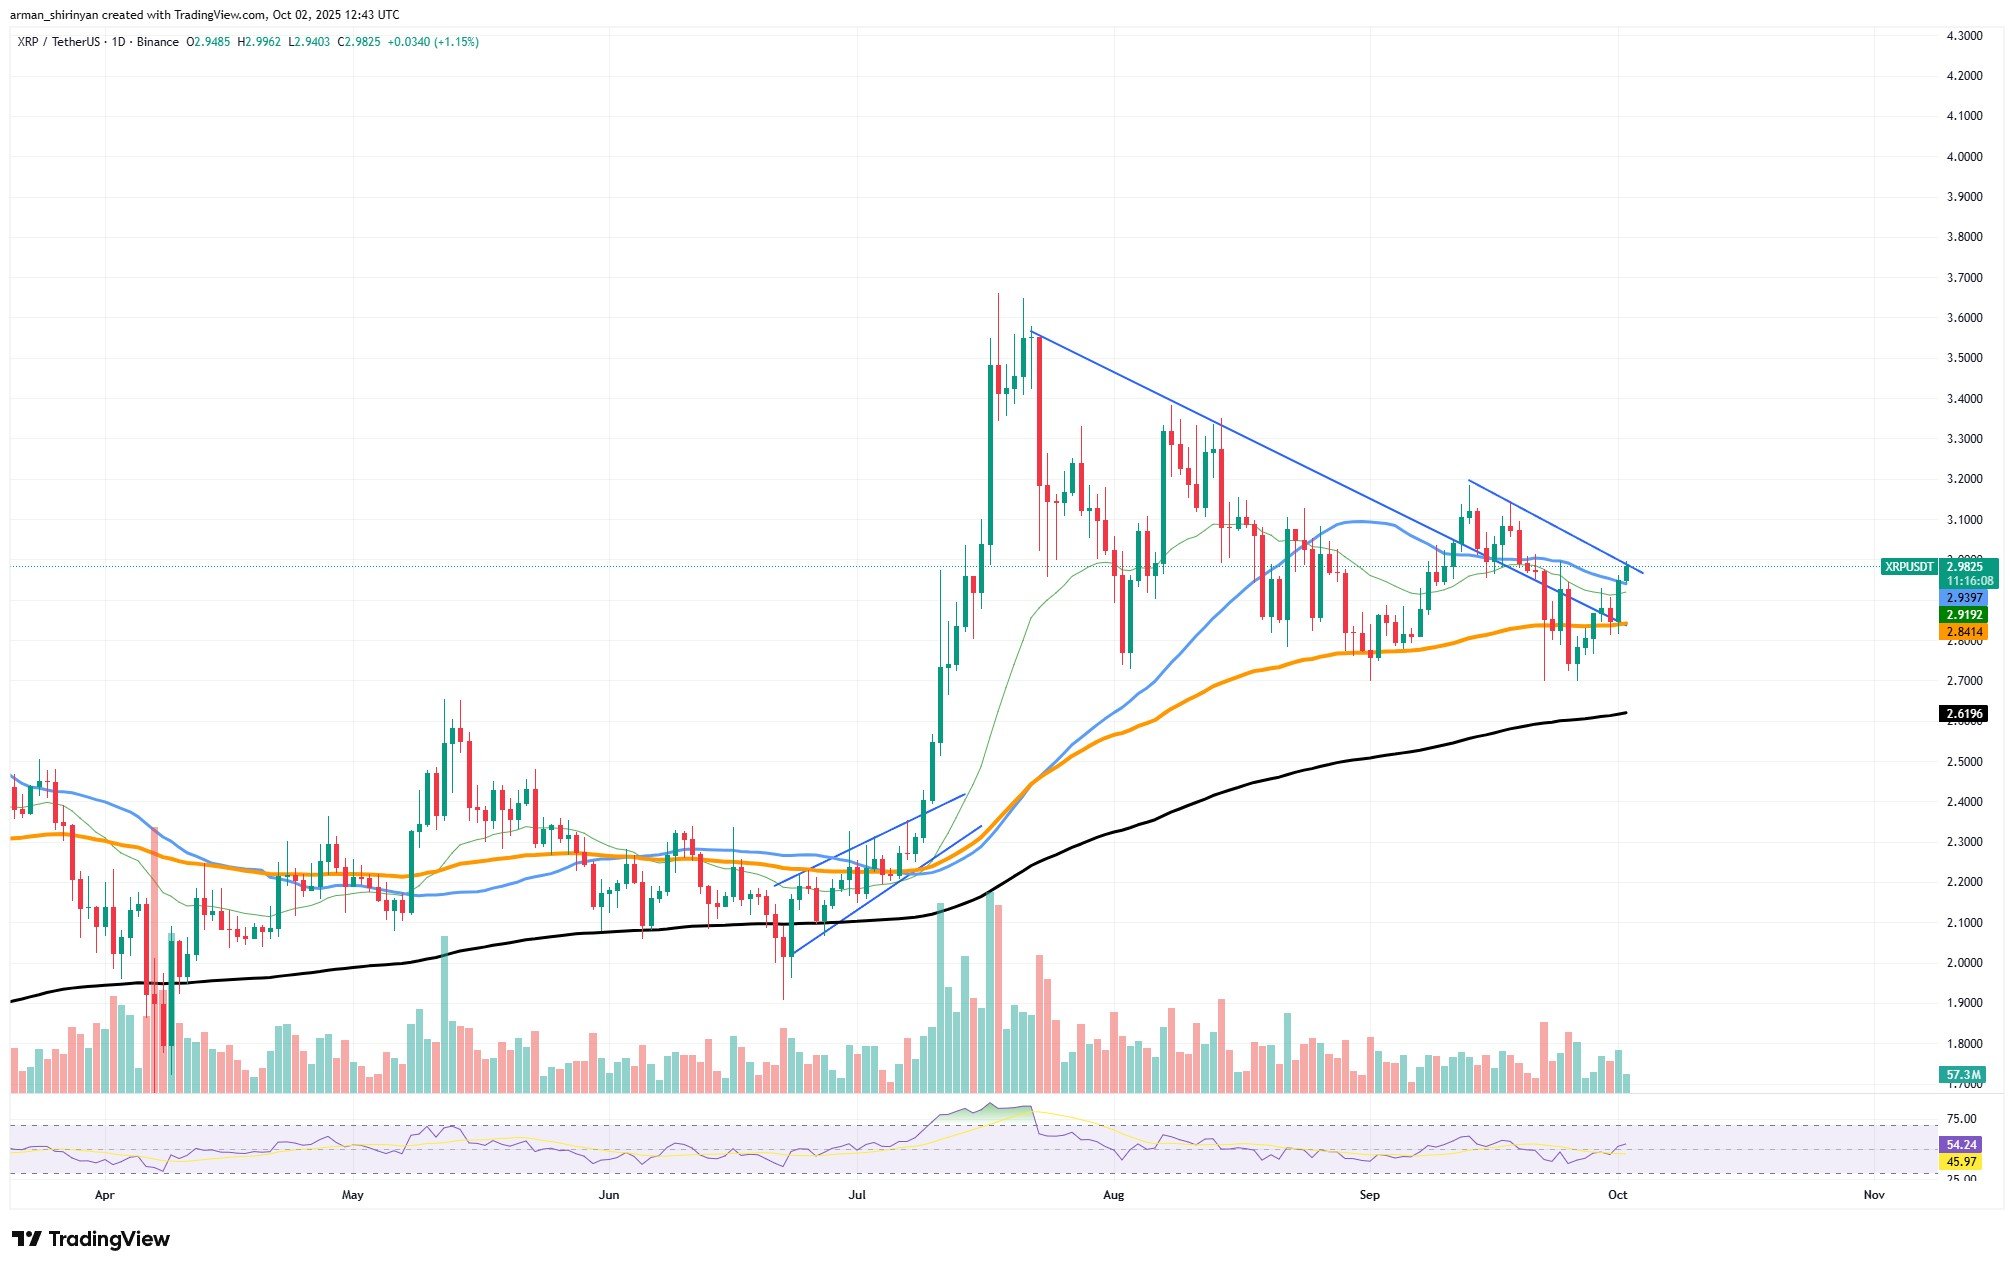
This level is very close to the crucial $3 threshold and has consistently rejected XRP since its peak in July. Selling pressure is particularly strong in this area due to the presence of a distinct downward-sloping resistance line and convergent moving averages. Despite the fact that interest in the asset has returned, the moderate volume indicates that there is not enough explosive confirmation to indicate a real breakout.
The RSI, on the other hand, is at about 55, giving XRP some leeway for growth while simultaneously indicating traders' caution. Higher levels at $3.20 and $3.50 might become possible if XRP can decisively break through the $3 resistance. The chart does, however, clearly indicate that this zone will serve as a barrier.
If the price does not break $3, it might retrace back toward $2.84 or even lower to $2.61. In the past, XRP has had difficulty holding onto gains above $3 in the absence of powerful catalysts, and the momentum of Bitcoin continues to dominate the market today. If there are no notable volume inflows or fundamental news, XRP might experience yet another severe rejection.
Bitcoin overheating
Bitcoin is on its way to hitting the $120,000 mark. A warning sign for the rally, though, is that Bitcoin is now approaching overbought conditions on a number of time frames, which raises the possibility of a pullback.
Bitcoin has surged above the 50 and 100 EMAs on the daily chart, demonstrating strong momentum following its recovery from support around $112,000. The RSI is currently above 70, indicating that the rally may be ahead of itself, even though momentum is still strong. Although volume has also increased during the surge, indicating that buyers are actively driving prices higher, these parabolic movements frequently result in temporary exhaustion.
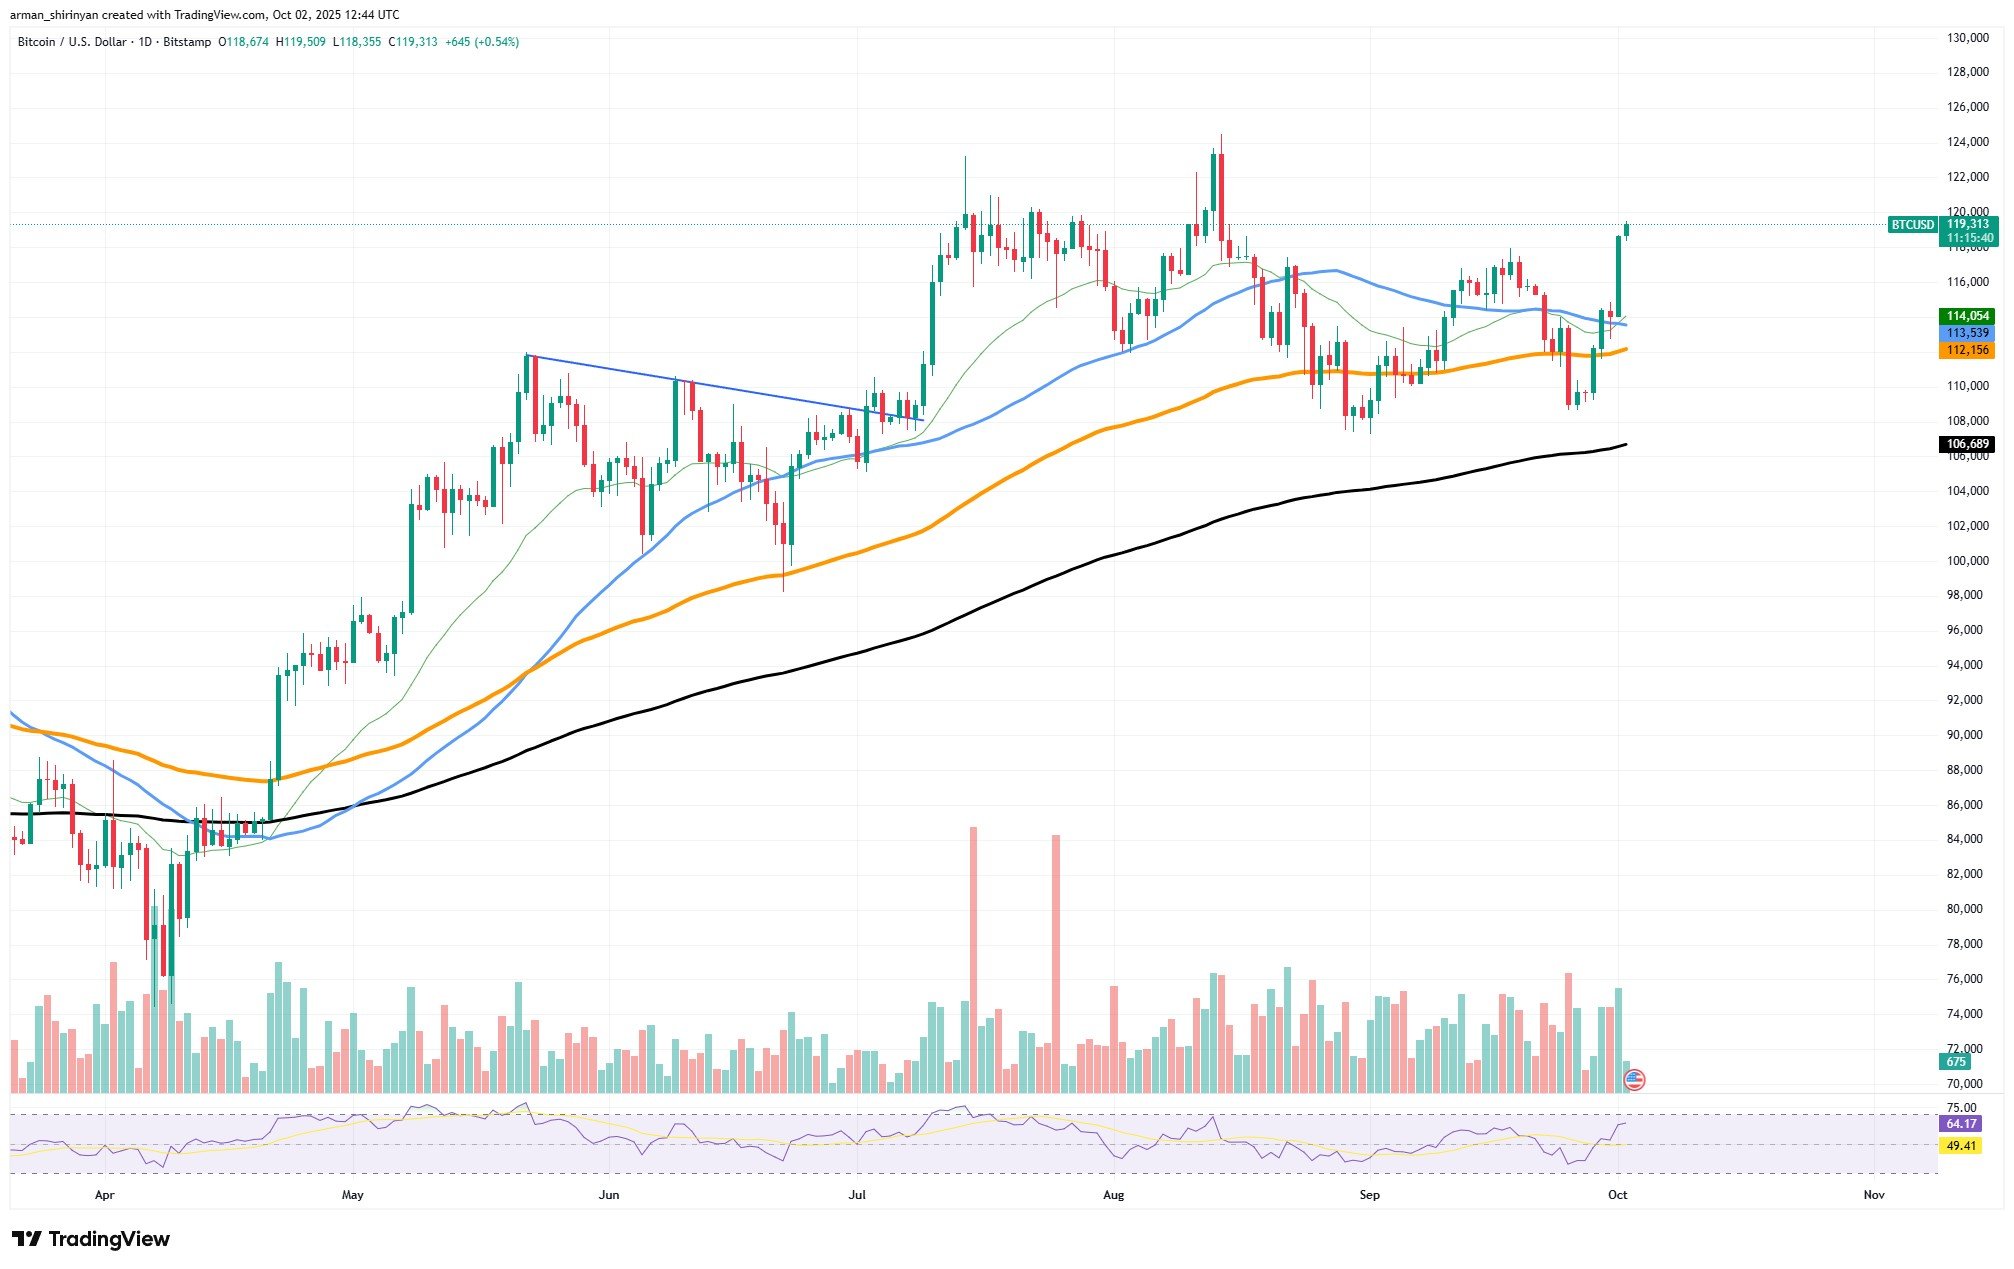
It is interesting to note that increased uncertainty in conventional markets is accompanied by this most recent rally. The U.S. government shutdown this week has caused volatility in the bond and equity markets. Bitcoin has historically done well in these times, and investors have used it as a substitute hedge. Indeed, when the previous U.S. government shutdown occurred, Bitcoin also saw a significant surge as traders sought assets outside of traditional finance.
The key resistance level, which serves as both a psychological barrier and a possible profit-taking zone, is currently at $120,000. The next targets for Bitcoin, if it can cleanly break above this level, are between $124,000 and $126,000. On the downside, the 200 EMA is close to $106,500, which would act as a deeper reset level if momentum wanes and $114,000 provides immediate support.
Shiba Inu's key confrontation
As it moves closer to the $0.000012 resistance level, Shiba Inu is confronted with one of its most crucial technical moments in months. This level could dictate the token’s course over the next 1-2 months, making it more than just another price checkpoint.
The daily chart shows that, following weeks of sideways consolidation, SHIB has recovered well from support around $0.0000114, regaining bullish momentum. As the price moves closer to the upper limit of its symmetrical triangle pattern, the 50 and 100 EMAs are serving as immediate obstacles.
SHIB is currently testing the $0.000012 zone, which has historically served as both strong support and resistance. A decisive breakout above this level could open the doors to $0.0000136 and $0.000014, aligning with the descending trendline resistance from earlier peaks. During this climb, volume has started to rise, albeit not dramatically, indicating cautious optimism among traders rather than pure euphoria.
The RSI, meanwhile, is slightly above 50, suggesting that the market is balanced and has potential for both upward continuation and correction should momentum wane. The downside risk is a return to the $0.0000114-$0.0000112 support range if SHIB is unable to break through $0.000012 with conviction. The consolidation phase would be prolonged by such a rejection, possibly postponing any breakout attempts until late October or early November.
Given the bullish sentiment on the larger cryptocurrency market, particularly with Bitcoin regaining its higher levels, and October (also known as Uptober) historically favoring rallies, SHIB’s current test is very important. Restoring retail flows into the token and solidifying bullish sentiment could be achieved by a successful breach of $0.000012.
 Dan Burgin
 U.Today Editorial Team