
Disclaimer: The opinions expressed by our writers are their own and do not represent the views of U.Today. The financial and market information provided on U.Today is intended for informational purposes only. U.Today is not liable for any financial losses incurred while trading cryptocurrencies. Conduct your own research by contacting financial experts before making any investment decisions. We believe that all content is accurate as of the date of publication, but certain offers mentioned may no longer be available.
Bitcoin has been moving sideways for almost a month, and traders are wondering what to expect from it next. Will it continue holding around $8K level, or there are dramatic changes coming? The traders from TradingView have an answer to this question. Let’s read their BTC price predictions and check the price charts & analysis.
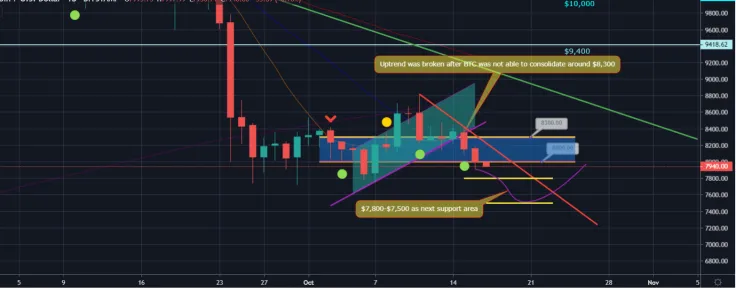
Look at the Bitcoin chart from tst643: the cryptocurrency opened the new seven-day period on Monday, October 14 with another attempt at $8,300. It moved up to $8,364 and once again closed above the mentioned level. It was of critical importance for bulls to defend $8,300 and consolidate there.
However, on October 15th, the BTC/USD pair lost 2.3 percent of its value and dropped to $8,152.The move was followed by another red session on October 16 when the coin moved below $8,000 and closed at $7,994. If BTC bulls don’t regain their positions, we can expect another visit to the $7,800 -$7,500 area.

The correction continues
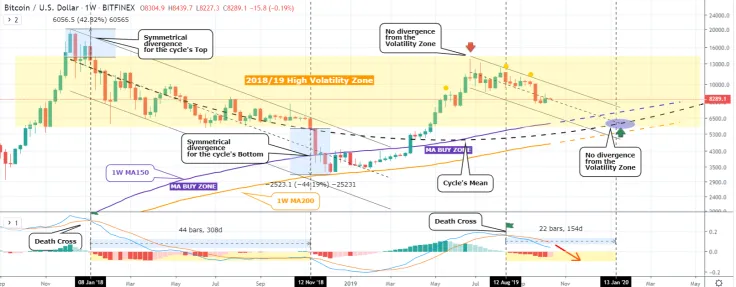
As usual, the user TradingShot analyzes the BTC technical indicators to come up with a few trading suggestions. Here’s what we can see:
-
The 1W MA Buy Zone. The MA periods provided Support in late 2018 and early 2019, were paving the way for April's aggressive bullish breakout. This is the new cycle's Buy Zone and every time the price approaches/enters it, long term buyers should accumulate.
-
The MACD on the logarithmic scale shows that based on the 2018 bear cycle, the current pattern that shares quite a few common characteristics with still has one last dip to make before it reverses.
Advertisement -
The Cycle's Mean: the symmetrical curved line taken from the middle of the 2018 Channel Down with the intent to provide the mean of the next Bull Cycle. It shows that the price may make contact with the MA Buy Zone again.
All the above parameters combined show an estimated bottom around the $6000 region and based on the LMACD measurement from the Death Cross, it could be achieved in half the time of the 2018 bear cycle.
 Dan Burgin
 U.Today Editorial Team