Disclaimer: The opinions expressed by our writers are their own and do not represent the views of U.Today. The financial and market information provided on U.Today is intended for informational purposes only. U.Today is not liable for any financial losses incurred while trading cryptocurrencies. Conduct your own research by contacting financial experts before making any investment decisions. We believe that all content is accurate as of the date of publication, but certain offers mentioned may no longer be available.
Although Chainlink is showing early indications of increased activity, it is important to keep in mind that this is taking place within a larger downtrend that has not yet been structurally broken.
Is ChainLink ready?
Considering how low participation has been in recent weeks, the recent 18% increase in 24-hour volume is what's important. After a decline from the $20+ region, LINK is currently consolidating in the $8.60-$8.80 range from a price standpoint.
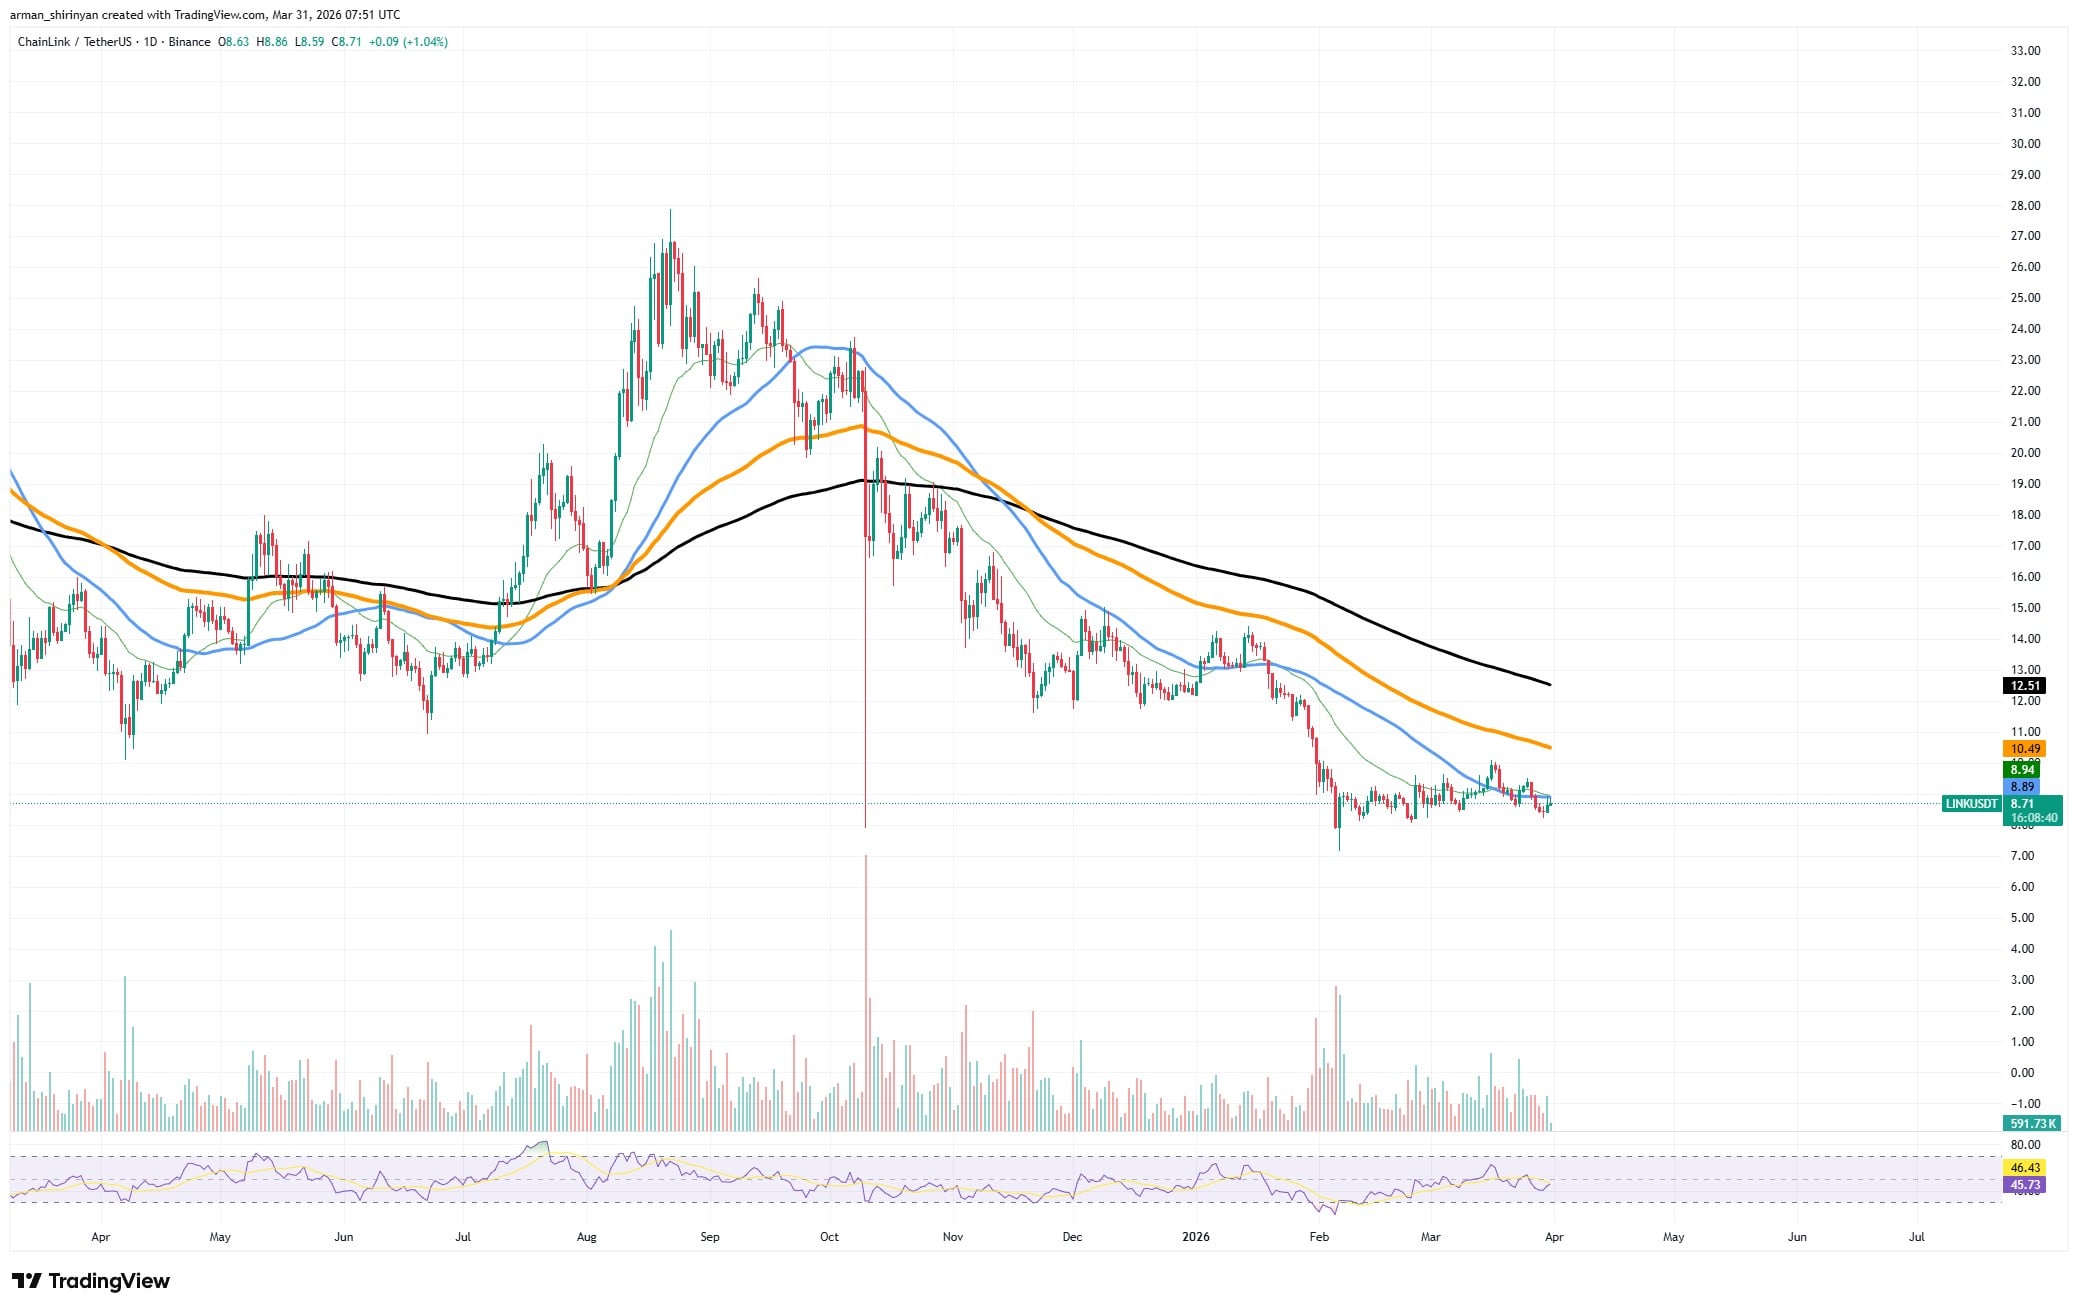
Lower highs, ongoing pressure from declining moving averages, and frequent rejection close to short-term resistance levels characterize the chart’s traditional downtrend structure. The 200-day is still well above, supporting the macro bearish bias, while the 50-day and 100-day moving averages continue to be above the price, serving as dynamic resistance.
Why is the volume spike important, then? Since it denotes a change in participation, volume expansion frequently signals the start of either distribution or accumulation following a protracted contraction phase. The more plausible explanation is early accumulation rather than new selling because the price has flattened into a range and is no longer sharply declining.
Capital rotation
A comparatively stable market cap of about $6.15 billion and a $321 million daily volume, with a 17% increase, indicate that capital is rotating rather than leaving. When the volume-to-market cap ratio rises above 5%, it suggests that traders are resuming their activity, which usually precedes an increase in volatility.

But there is no need to exaggerate this just yet. No significant resistance has been regained by the price. This market is still range-bound and bearish until LINK decisively breaks above the $10-$11 range.
Reaction at resistance is another important component. LINK would indicate distribution rather than accumulation if it were to approach the declining trendline or moving averages and be rejected once more on high volume.
LINK's volatility is decreasing, participation is increasing and pressure is rising. The subsequent movement, whether it be upward or downward, will probably be more pronounced than what the market has recently experienced.
 Dan Burgin
 U.Today Editorial Team
 Vladislav Sopov