
Disclaimer: The opinions expressed by our writers are their own and do not represent the views of U.Today. The financial and market information provided on U.Today is intended for informational purposes only. U.Today is not liable for any financial losses incurred while trading cryptocurrencies. Conduct your own research by contacting financial experts before making any investment decisions. We believe that all content is accurate as of the date of publication, but certain offers mentioned may no longer be available.
Cardano (ADA) has confirmed a death cross on the daily price chart as the crypto asset continues to show bearish trends. In the past 24 hours, the ADA price dropped more than 1.2%, according to CoinMarketCap data.
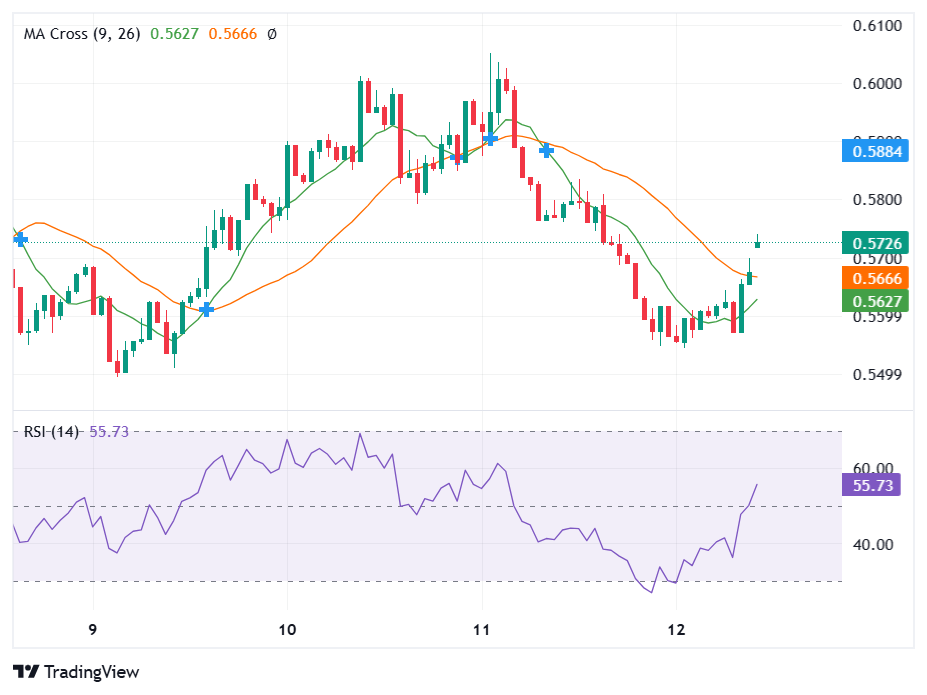
Death cross formed on ADA charts
As seen on a TradingView chart, Cardano peaks near $0.610 before a series of bearish red candles, driving it down to roughly $0.489.
The death cross formation, which is a bearish technical signal, happened when the 9-period SMA crossed below the 26-period SMA.
The Cardano chart revealed a tight spread between the SMAs. The 9-period SMA came in at $0.5627, while the 26 SMA happened at $0.5666, indicating weakening momentum but sustained bearishness.
Historically, this pattern preceded times when major cryptocurrency assets have experienced a prolonged price downtrend or consolidation. For ADA, the timing of this bearish pattern could not be worse.
ADA has experienced a steady decline since September, and the confirmation of the death cross now confirms the almost two-month bearish structure.
This aligns with recent U.Today reports, where Cardano confirmed a death cross on its hourly charts. Specifically, the 50-period MA crossed below the 200-period MA, reflecting short-term selling pressure amid a four-day decline from $0.693.
Is there hope for future Cardano ADA rally?
Cardano is currently trading at $0.5731, down 1.2% over the past 24 hours. This decline pushed monthly and yearly gains down 18.8% and 2.1%, respectively.
A deeper retracement is now possible due to the breakdown below the $0.66 support level. Also, the next strong demand zone is located between $0.55 and $0.56.
However, the Relative Strength Index (RSI) showed upside potential. Notably, the RSI is not deeply oversold yet at 55.

This suggests room for further downside before a potential bounce. Also, an RSI bounce above 60 could signal a reversal, especially if crypto more broadly rebounds.
Meanwhile, the recent ADA price dip is not an isolated signal but part of a broader sell-off in November 2025. Bitcoin (BTC), the leading market coin, has dropped more than 8.2% over the past month.
Furthermore, Cardano whales have been offloading their coins, amplifying the selling pressure. In just two weeks, Cardano whales sold 140 million ADA coins as they engaged in profit-taking moves.
 Dan Burgin
 U.Today Editorial Team