
Unfortunately, bears managed to push aside bulls and rolled back the cryptocurrency market to the position of the previous week.
However, against a slight correction, not all coins have followed BTC decline. Apparently, investors paid attention to the undervalued altcoins and began to catch up with the market.
Some of the top assets are even showing growth in correlation to the leading cryptocurrency; IOTA is ahead of others as its rate has soared by 12% against BTC over the 24 hours.
Today decline also influenced BTC domination index, which has decreased and not makes up 56.6%.
Now, let’s analyze the technical picture of the top 3 coins.
BTC/USD
Despite the today price drop, return on investment in the first cryptocurrency was 143% since the beginning of this year. The ROI in Bitcoin is several times higher than that of traditional market assets.
On the other hand, compared with some altcoins, the return on investment in BTC may seem low. For example, since the beginning of the year, Binance Coin has increased by 475%, Tezos - by 255%, Litecoin - by 254%.
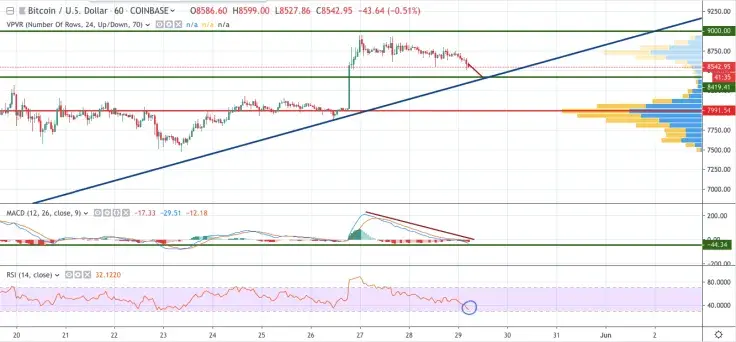
At the moment, the main digital asset is moving towards $8,450 according to our earlier scenario. In terms of the hourly graph, bulls lost their positions to a certain extent and passed the baton to bears.
The decline may continue to the $8,400 support level, but not deeper, as the RSI indicator has almost reached the oversold line.
MACD has also been bearish for 2 days and currently located on the verge of the trend change. Taking into account such course of events, a new ATH at $9,000 is supposed to achieved on June 1.
The price of BTC is trading at $8,543 at the time of writing.
ETH/USD
Although Ethereum’s position on the market looks better than of BTC, the asset is the red zone, having lost around 1% over the night. The possible reason for the minor correction is the introduction of JPMorgan a new anonymity mechanism for Ethereum-based blockchains.
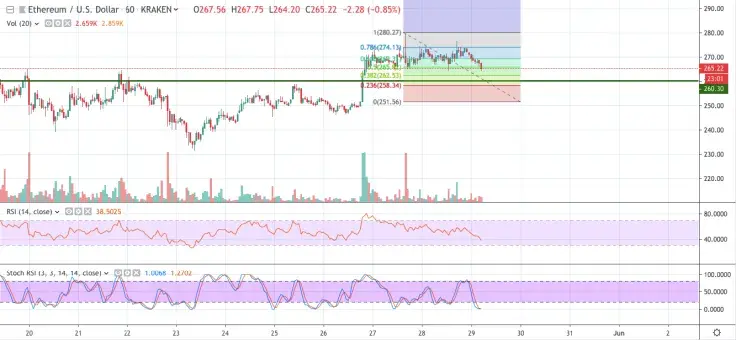
However, the relatively positive news background could not hold the most popular altcoin from a decline. Now, the quotes of ETH are trading based on our recent analysis.
Concerning the technical indicators, the price of Ethereum is trading similar to Bitcoin movements. Such a remark is supported by the Stochastic RSI and RSI patterns, which are about to reach the bottom.
Besides, the Fibonacci retracement shows that the last chance when buyers can enter the market is $258.34 (23.6%). If such a scenario justifies itself, the price should bounce back to the previous areas and above.
The price of ETH is trading at $265.39 at the time of writing.
XRP/USD
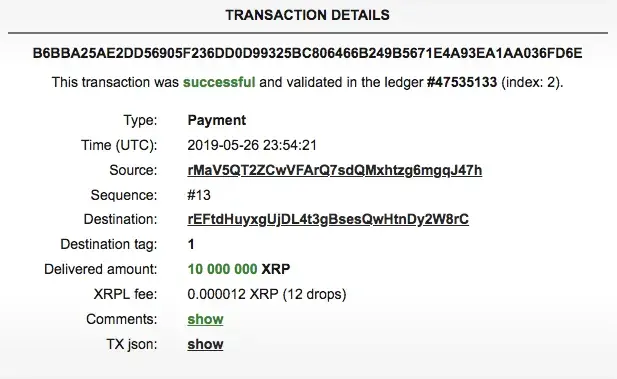
Ripple has proved the community once again that it has own movement patterns whatever happens on the cryptocurrency market. The current situation has positively affected XRP’s price, as it is the only top coin whose rate has decreased by a relatively small percentage. A possible reason for this might be a purchase of $10 Mln XRP through an over-the-counter (OTC) platform.
Regarding the technical analysis, the situation looks the following way.
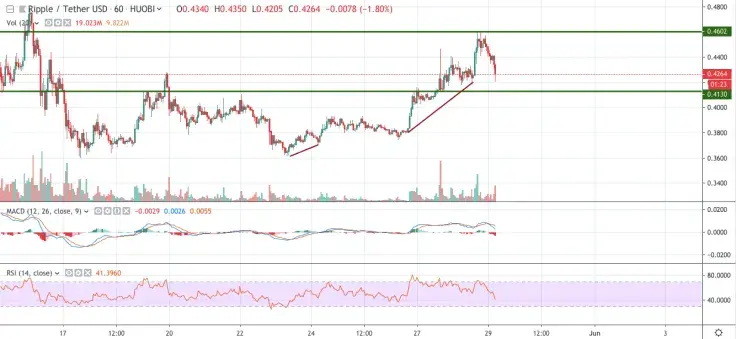
On the hourly chart, bearish tendencies prevail over bullish ones; however, one should not expect a correction, rather a rollback to the support at $0.4130. The RSI indicator and MACD are looking neutral, confirming that a more profound price movement is postponed. What is more, trading volumes remain high, which supports the suggestion that bulls are not going to leave the market.
The price of XRP is trading at $0.4258 at the time of writing.

 Denys Serhiichuk
 Gamza Khanzadaev
 Caroline Amosun
 Tomiwabold Olajide
 Alex Dovbnya