
The picture of the market as a whole has not changed over the past day: Bitcoin is setting the dynamics, and less liquid coins repeat it in various variations. All 10 coins are showing slight growth, except Binance Coin and Stellar, whose prices have declined by around 1%.
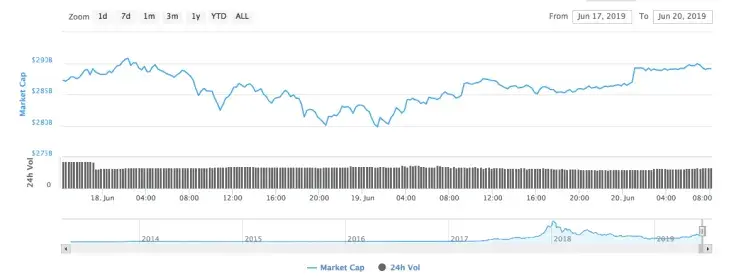
Even though the cryptocurrency market has been in a sideways trend for a few days already, the total capitalization index has gained $4 bln over the night, suggesting that traders are still in the game.
BTC/USD
Bitcoin did not follow our scenario yesterday, and the quotes rose above $9,200 again. The cryptocurrency continues its upward movement; the attempt to form the Head and Shoulders reversal pattern was canceled.
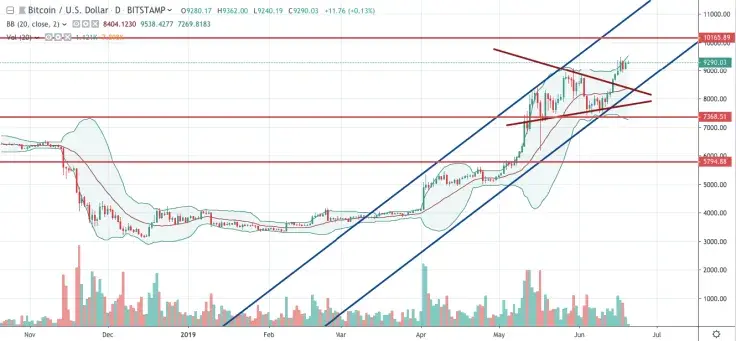
At the moment, attention is focused on the Triangle model. Quotes struck the upper limit of the figure, and one can talk about the continuation of the rise of BTC with the first goal at $10,105.
Moreover, Bitcoin tested the lower border of the Bollinger Bands figure. The price was able to push off from this area, which indicates the presence of an upward trend. As the main trading scenario, we should expect BTC correction to the upper border of the Triangle at the level of $8,940 and then continued growth.
The price of BTC is trading at $9,291 at the time of writing.
ETH/USD
Ethereum keeps trading above the upper boundary of the rising channel, and our recent price prediction is justifying itself at the moment.
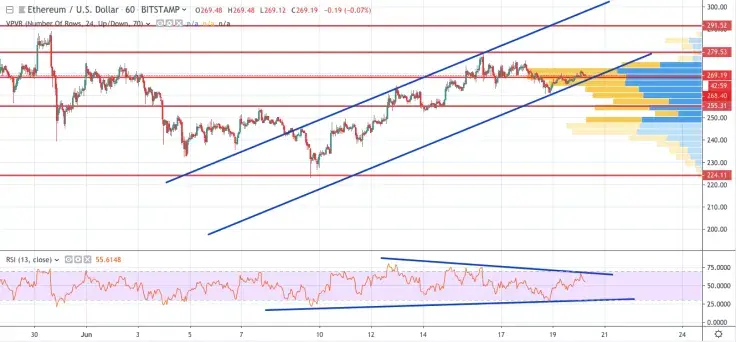
On the hourly chart, a harmonious trading model “5-0” is being formed. As part of this pattern, Ethereum is expected to drop and test the lower boundary of the channel at $255, and then rebound and continue growth with a target at $290.
In favor of this option, there is a rebound from the trend line on the RSI indicator. Confirmation of growth will be the breakdown of the descending line on the indicator and closing quotes above $280.
The price of ETH is trading at $269.55 at the time of writing.
XRP/USD
Against the sideways trend on the market, Ripple is not giving up the acquired positions so fast. On the hourly chart quotes pushed off the resistance level. As the main trading idea, traders can expect a test of the lower boundary of the channel and continued growth. An additional signal will be the next bounce from the uptrend line on the RSI indicator. The confirmation will be the breakdown of the upper border of the side corridor and the closure above $0.46.
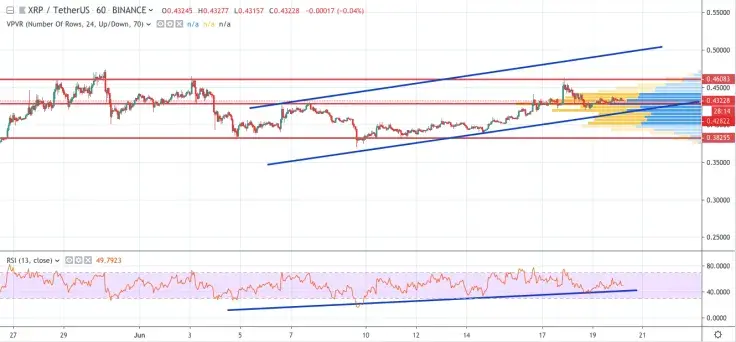
The cancellation of the growth will be the breakdown of the lower boundary of the corridor with the closing of positions under the level of $0.38. In this case, a sharp drop is expected with a target below $0.27.
The price of XRP is trading at $0.4321 at the time of writing.
 Dan Burgin