Disclaimer: The opinions expressed by our writers are their own and do not represent the views of U.Today. The financial and market information provided on U.Today is intended for informational purposes only. U.Today is not liable for any financial losses incurred while trading cryptocurrencies. Conduct your own research by contacting financial experts before making any investment decisions. We believe that all content is accurate as of the date of publication, but certain offers mentioned may no longer be available.
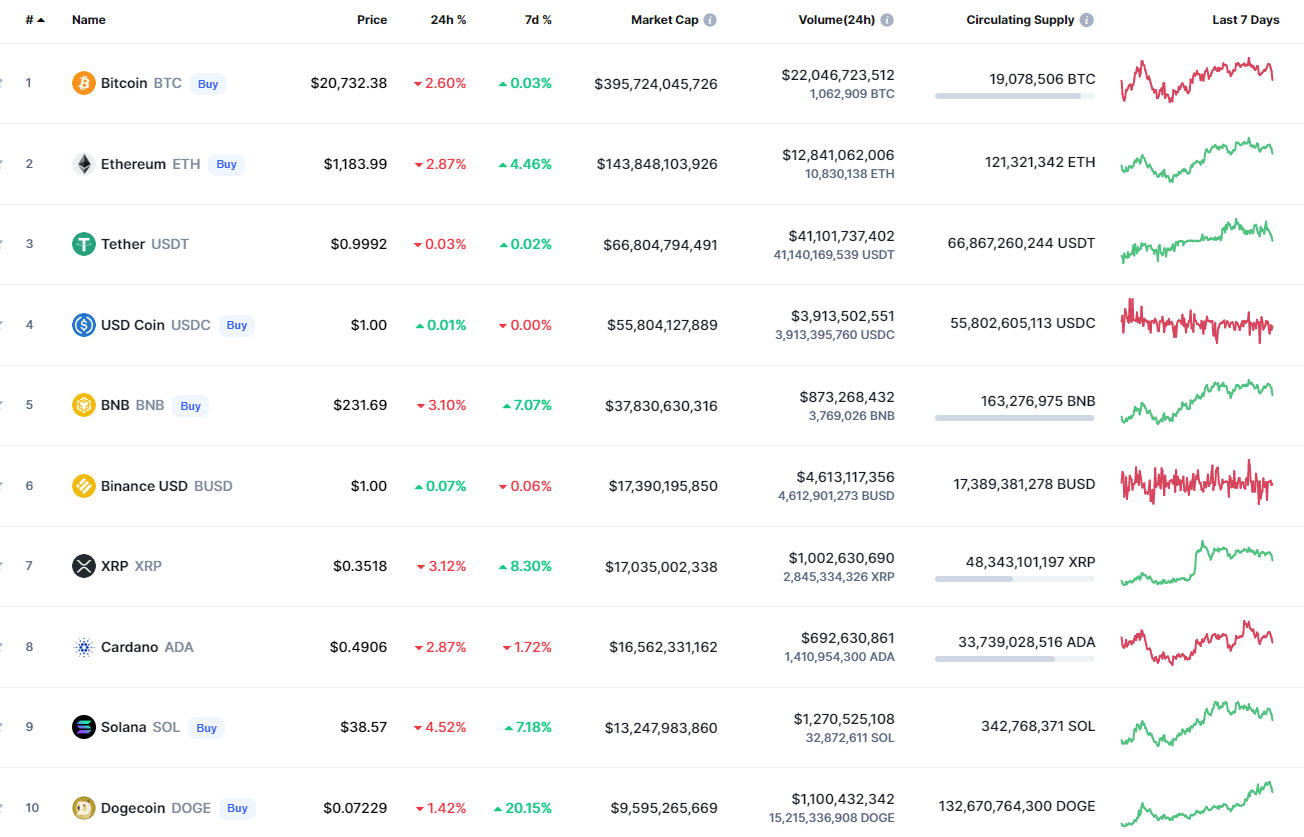
The new week has started with a slight correction in the cryptocurrency market as most of the coins are in the red zone.
BTC/USD
The rate of Bitcoin (BTC) is going down, falling by 2.60% over the last 24 hours.
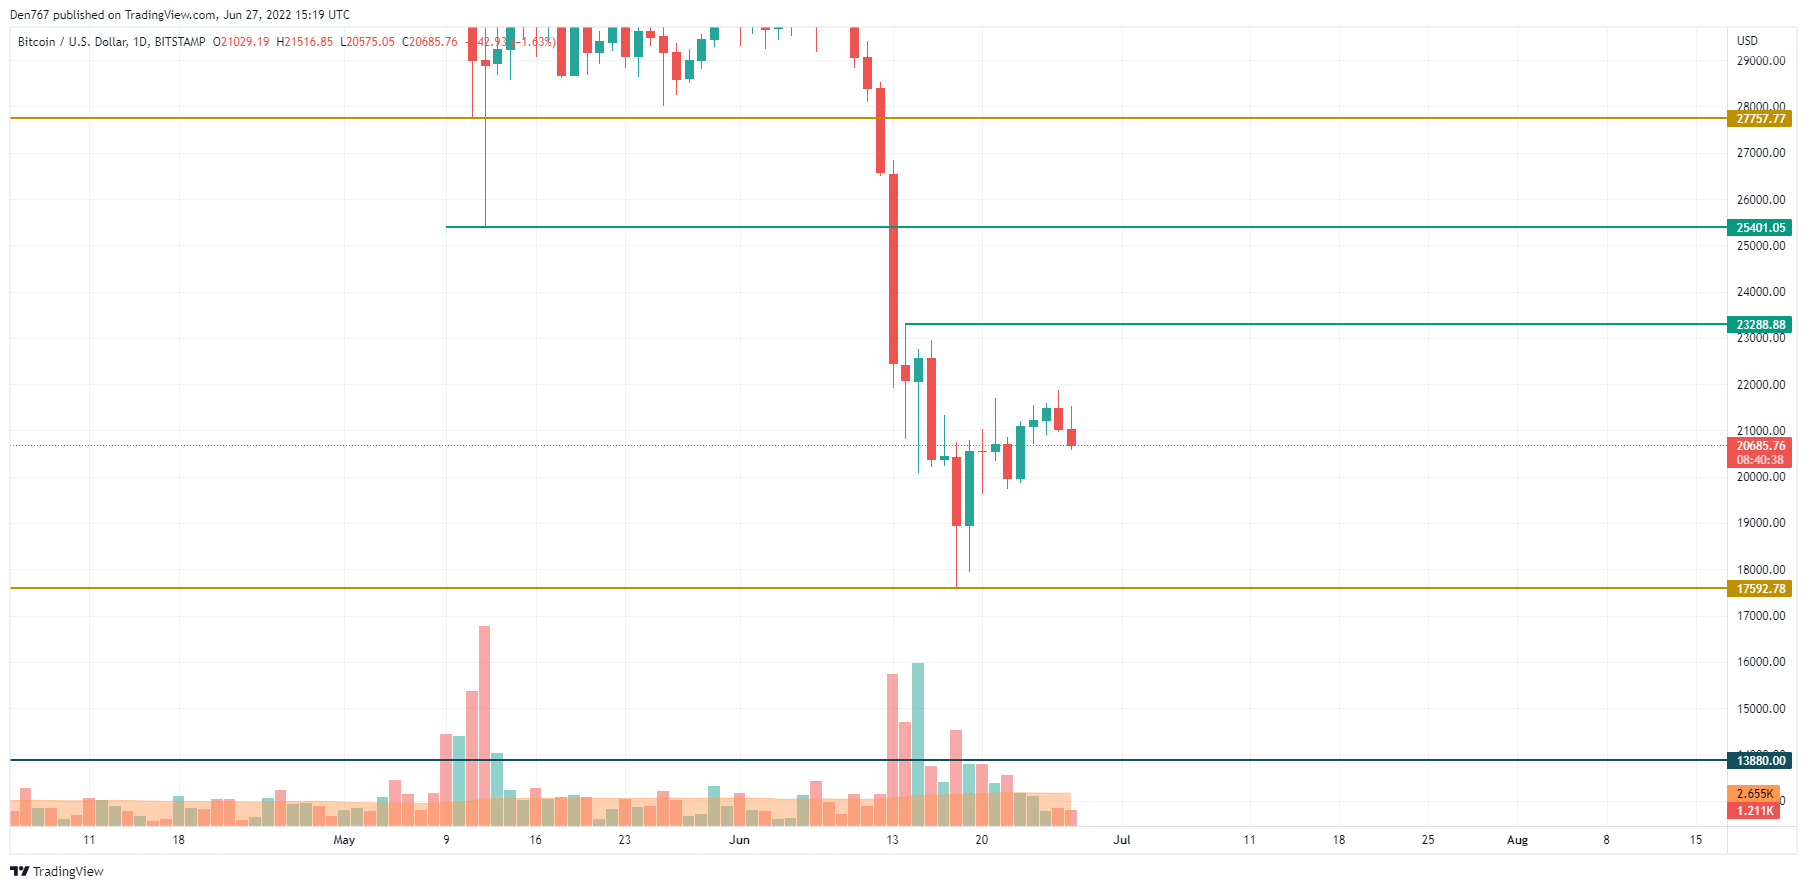
Bitcoin (BTC) could not fix above $21,000 for a long time on the daily chart. At the moment, one needs to pay attention to the zone of around $20,500. If buyers can hold it, there are chances to see them bounce back. Thus, the selling volume is low which means that bears are not powerful enough yet.
Bitcoin is trading at $20,663 at press time.
ETH/USD
Ethereum (ETH) is more loser than Bitcoin (BTC) as the drop of the main altcoin has made up 2.83%.
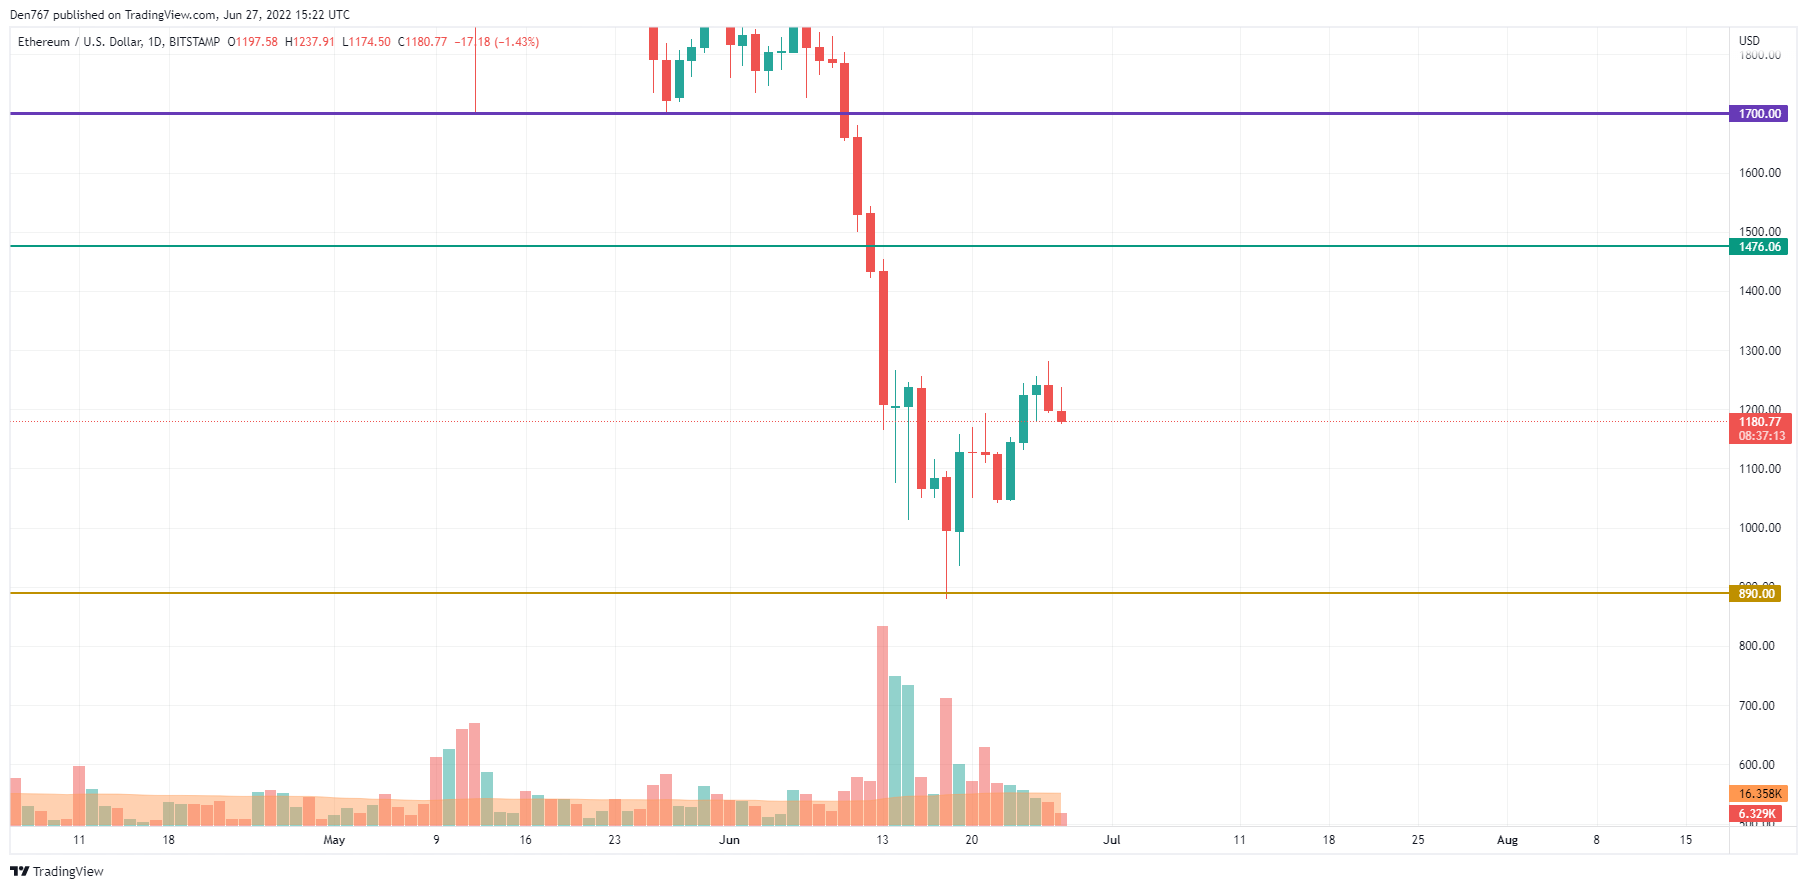
Ethereum (ETH) has also lost its vital level at $1,200. However, there are no reasons for panic as the price remains trading above the $1,100 mark. In this case, the more likely scenario is the false breakout of the $1,150 zone, followed by a sharp rise. If that happens, traders might see the rate of ETH around $1,300 within the nearest weeks.
Ethereum is trading at $1,185 at press time.
XRP/USD
XRP is the biggest loser from the list today as the decline has accounted for almost 3%.
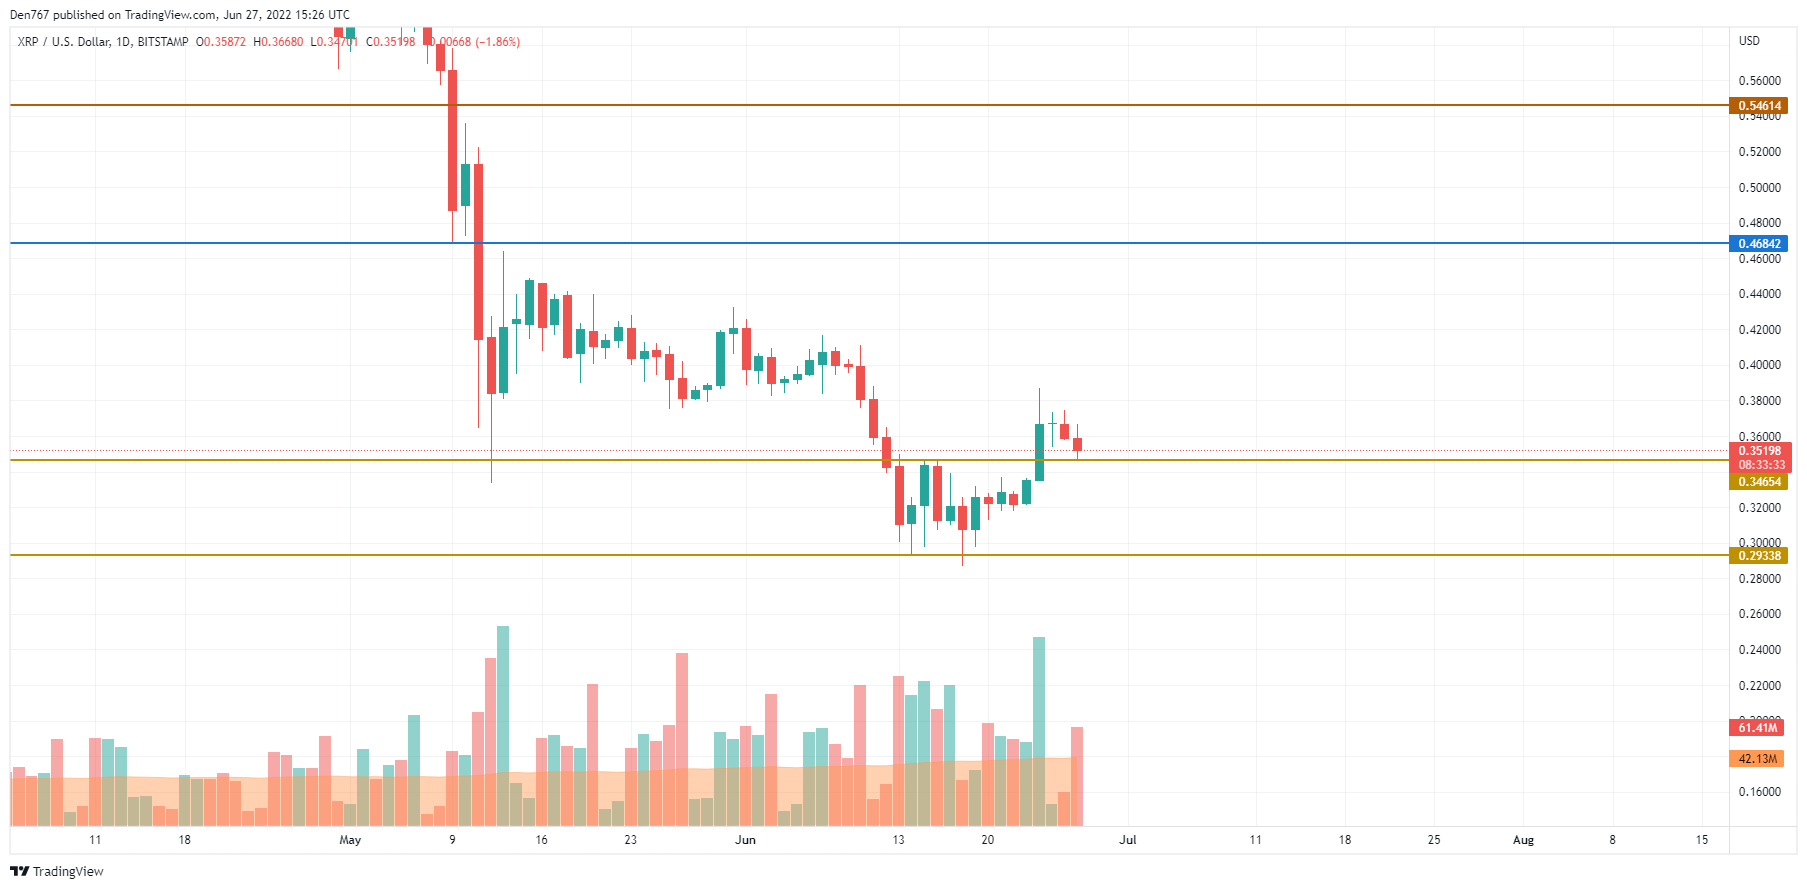
Despite the decline, XRP has remained bullish as the rate has successfully tested the recently formed mirror level at $0.3465. Until the price is above it, there are more chances to see the growth than the fall. However, if the bears' pressure continues and the daily candle fixes below the mentioned level, then drop to the $0.34 zone is a matter of time.
XRP is trading at $0.3523 at press time.
 Dan Burgin
 U.Today Editorial Team