Disclaimer: The opinions expressed by our writers are their own and do not represent the views of U.Today. The financial and market information provided on U.Today is intended for informational purposes only. U.Today is not liable for any financial losses incurred while trading cryptocurrencies. Conduct your own research by contacting financial experts before making any investment decisions. We believe that all content is accurate as of the date of publication, but certain offers mentioned may no longer be available.
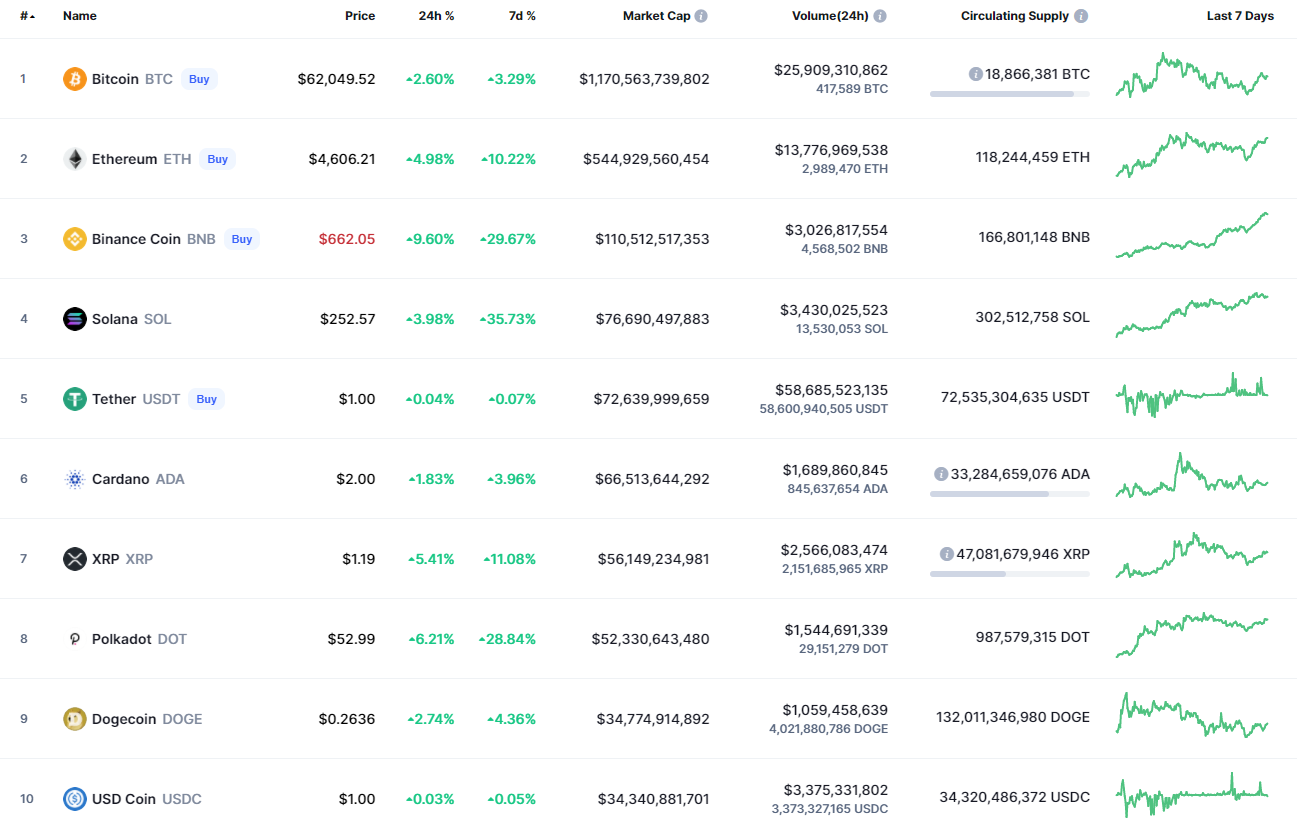
The last day of the week has turned out to be bullish for the cryptocurrency market as all of the top 10 coins are in the red zone.
BTC/USD
The rate of Bitcoin (BTC) has increased by 2.90% over the last week.
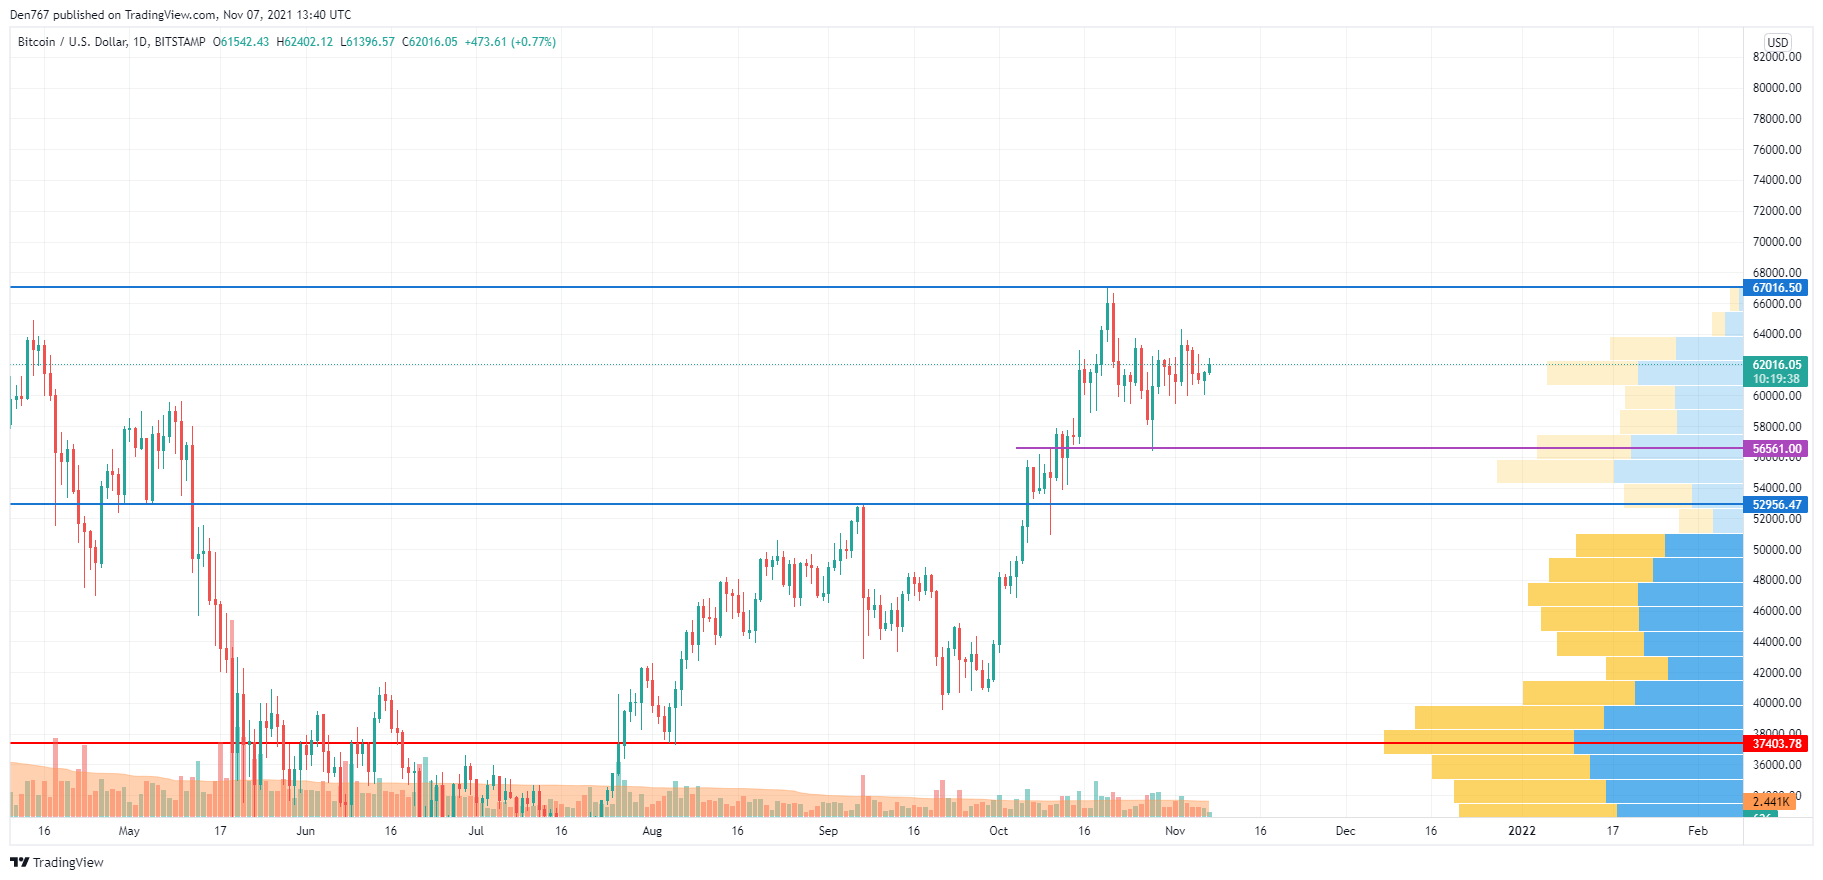
Despite the rise, Bitcoin (BTC) keeps trading sideways as bulls could not seize the initiative and come back to the peak at $67,000. The trading volume is low, which means that there is a high chance to see BTC trading in the range of $60,000-$66,000 next week. The bearish scenario becomes relevant if the main crypto breaks the support at $56,560 and fixes below it.
Bitcoin is trading at $62,044 at press time.
DOGE/USD
DOGE has shown almost the same price action as Bitcoin (BTC) this week.
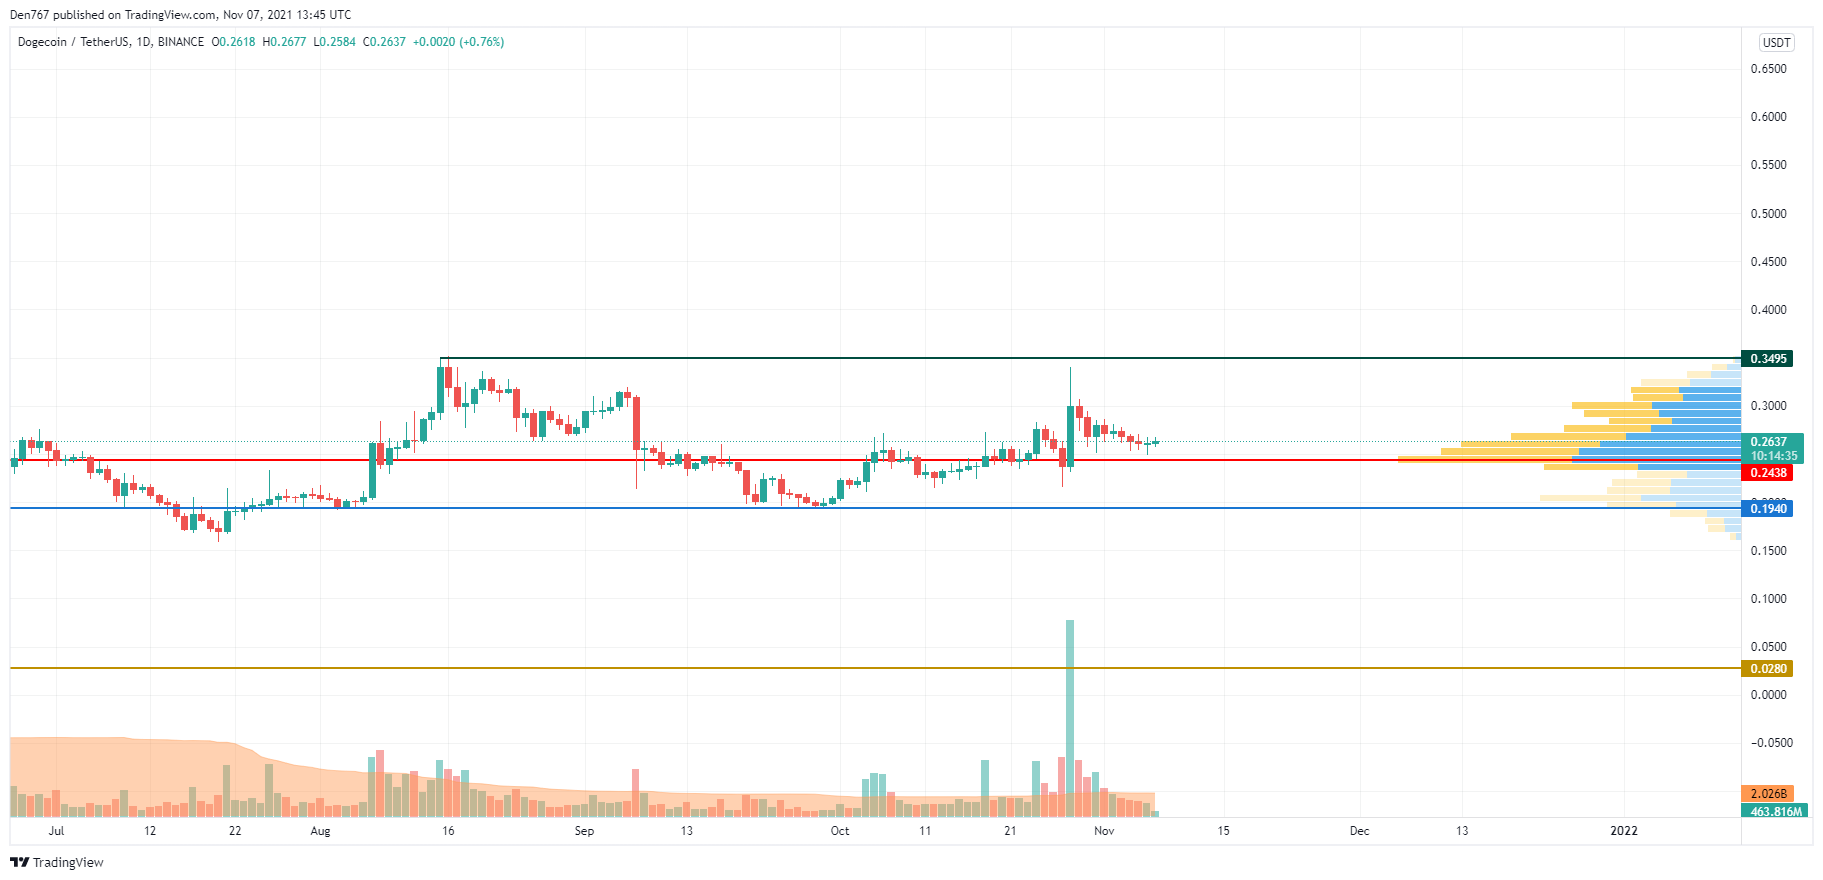
DOGE is neither bullish nor bearish as the meme coin keeps trading near the zone of the most liquidity, which means that it is accumulating power for a further sharp move. One may expect a continued rise if bulls get DOGE back to the zone around $0.3. The increased trading volume might confirm the possible growth.
DOGE is trading at $0.2638 at press time.
SHIB/USD
SHIB is the main loser today. It is the only coin from the top 20 list that is trading in the red zone.
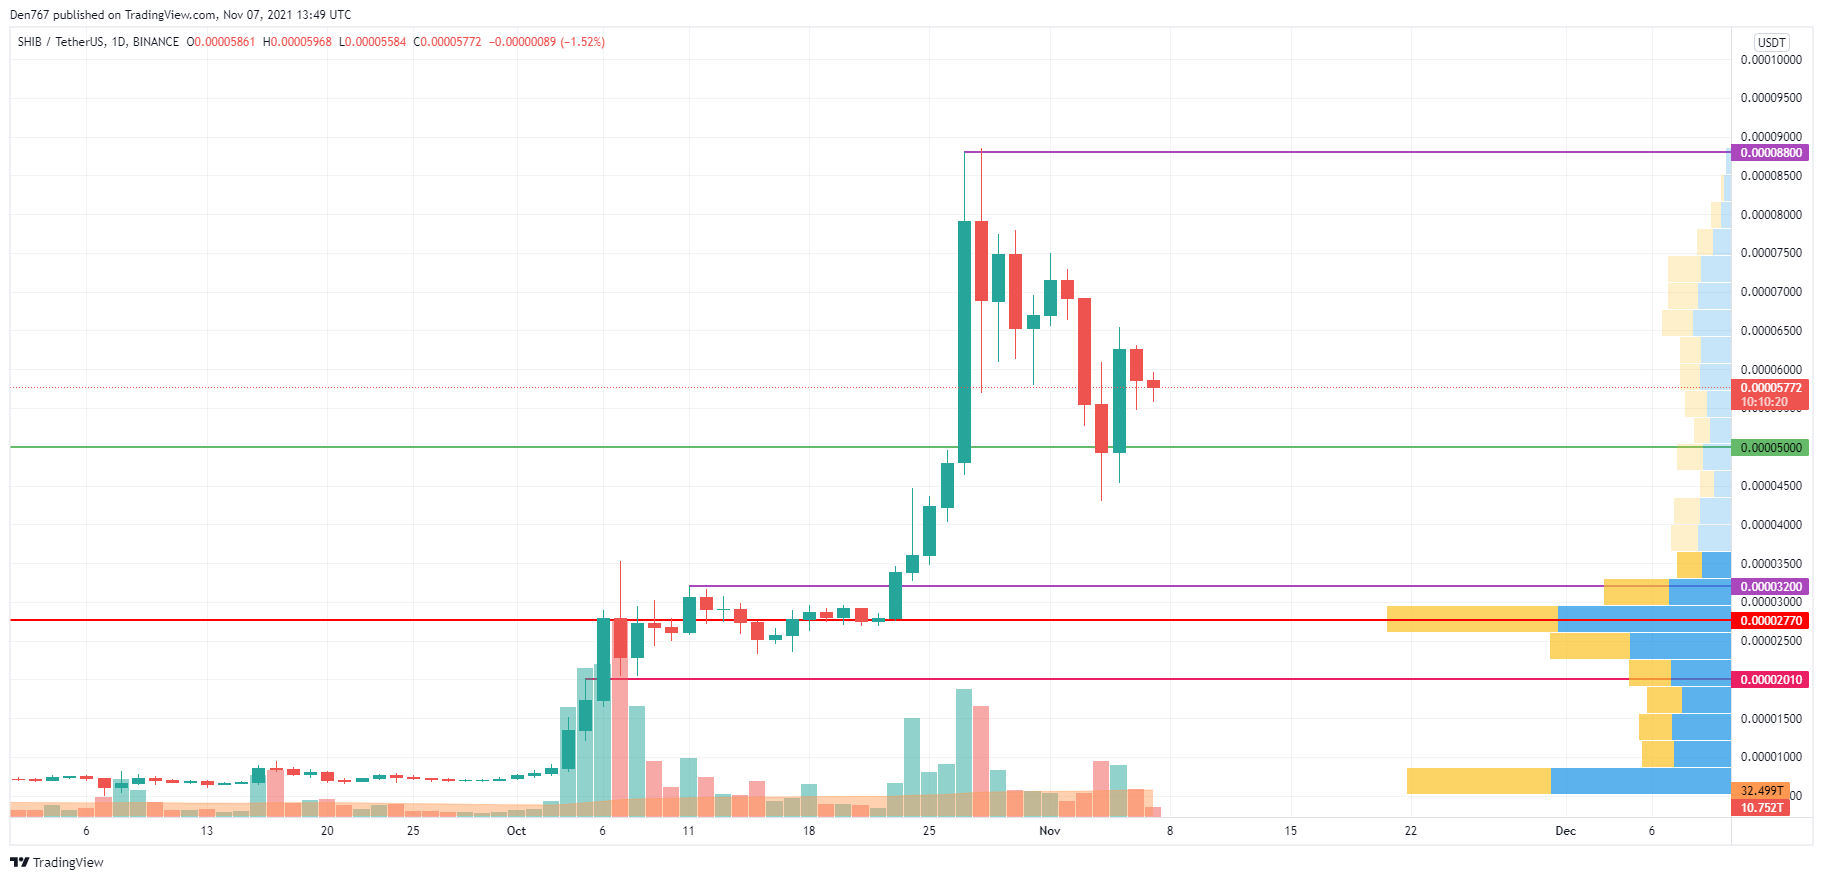
On the daily time frame, SHIB made a false breakout of the support at the $0.00005 mark. At the moment, the coin is trading in a wide range between the support and the resistance at $0.000088.
In terms of the further price action, SHIB may keep trading within the mentioned levels so it can gain more energy for either a rise or decline.
SHIB is trading at $0.00005746 at press time.
 Dan Burgin