
Disclaimer: The opinions expressed by our writers are their own and do not represent the views of U.Today. The financial and market information provided on U.Today is intended for informational purposes only. U.Today is not liable for any financial losses incurred while trading cryptocurrencies. Conduct your own research by contacting financial experts before making any investment decisions. We believe that all content is accurate as of the date of publication, but certain offers mentioned may no longer be available.
Despite the growth yesterday, bulls cannot hold the initiative, and the market has faced a sharp dump.
BTC/USD
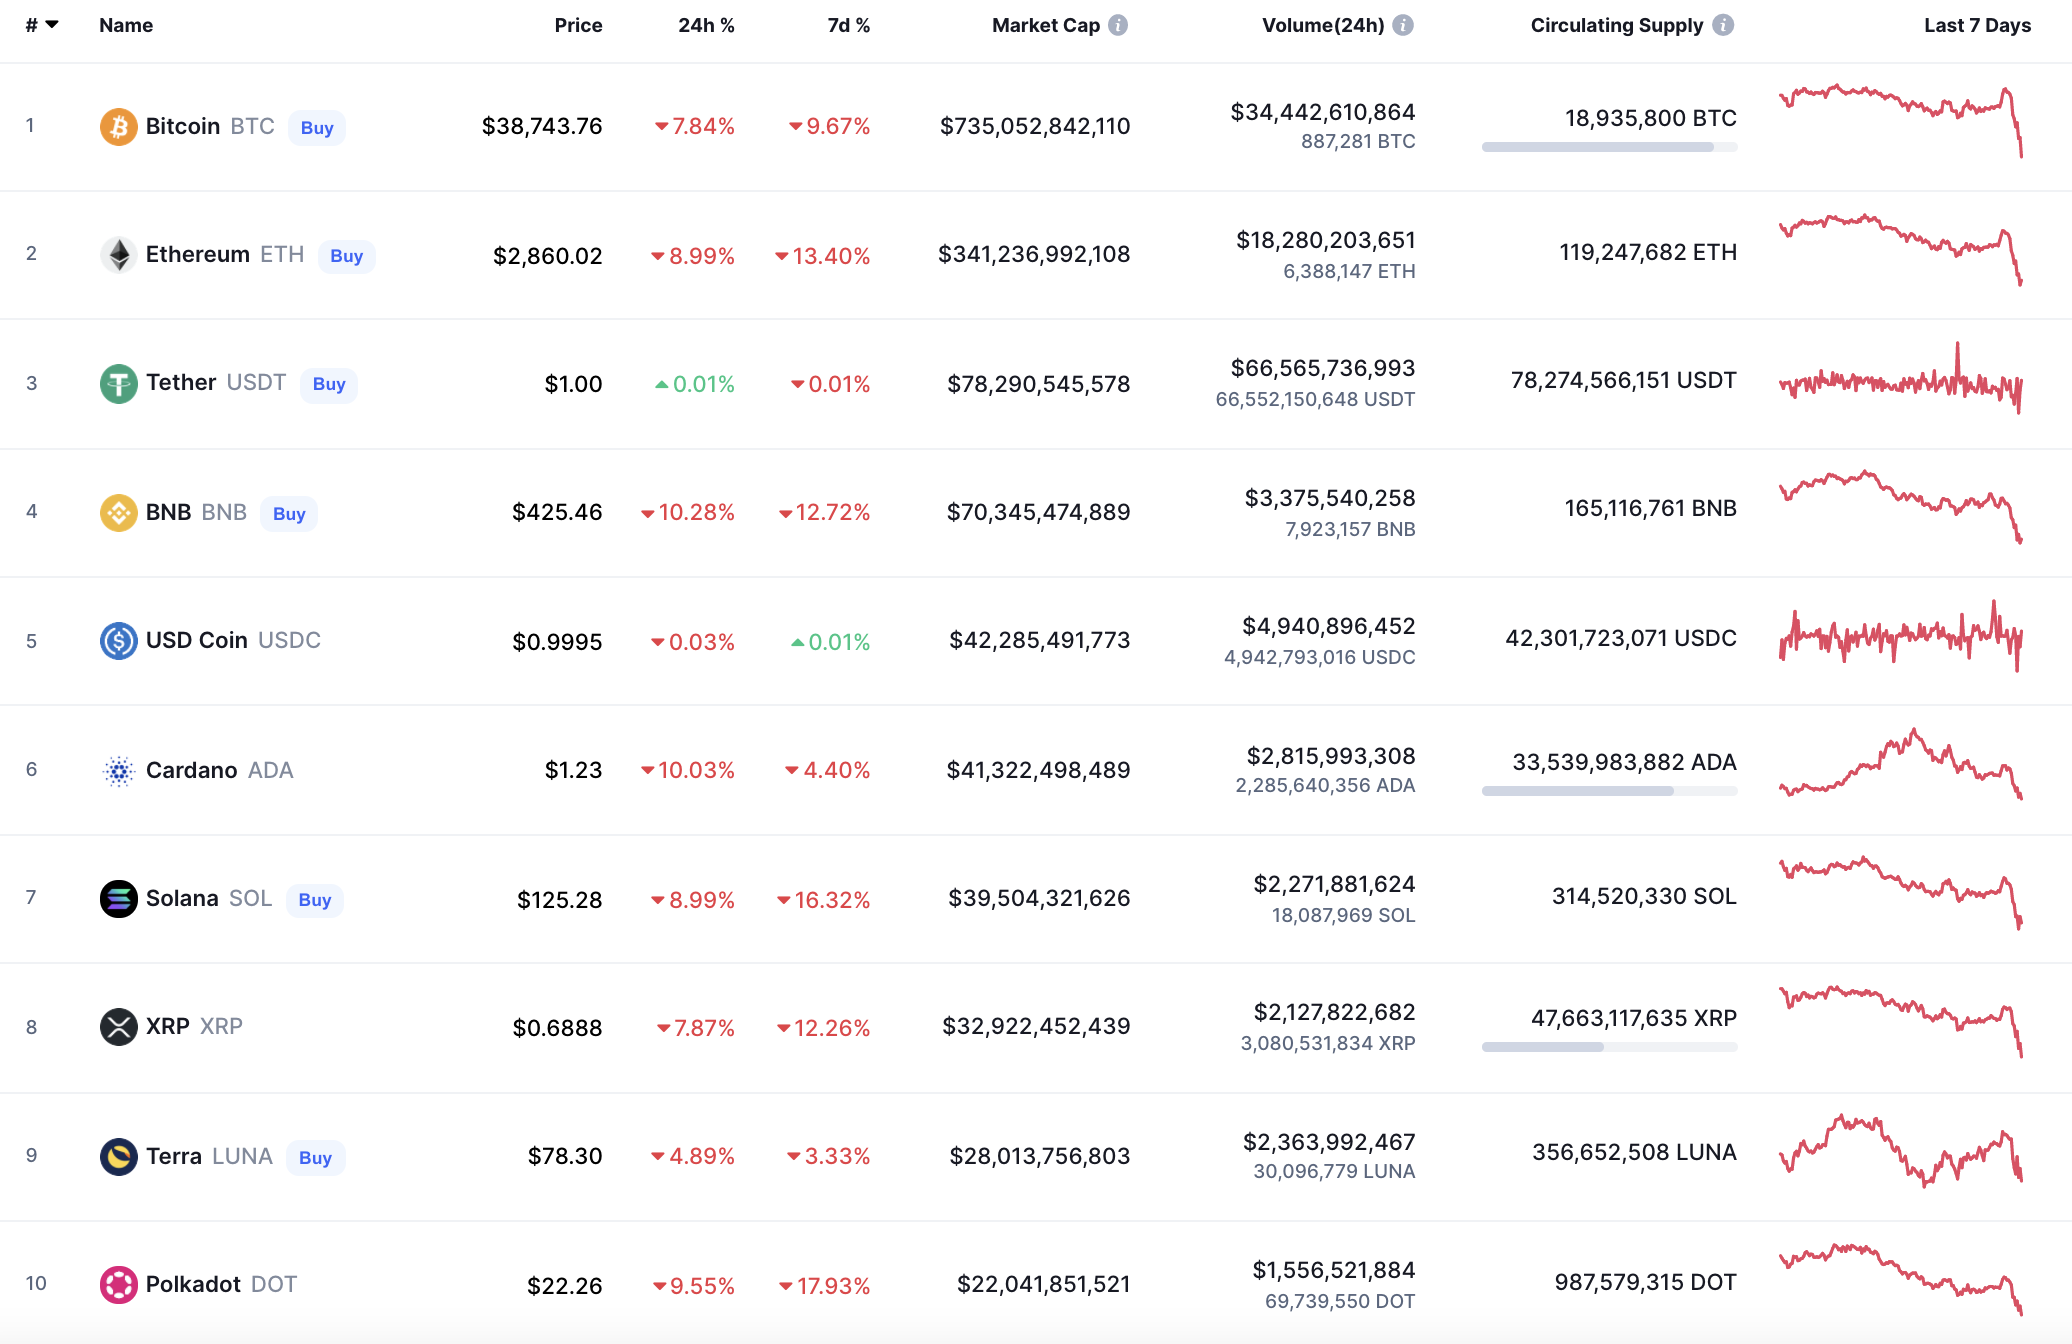
The price of Bitcoin (BTC) has dropped much less compared to the other main coins. It has declined by 7.84% over the last day.
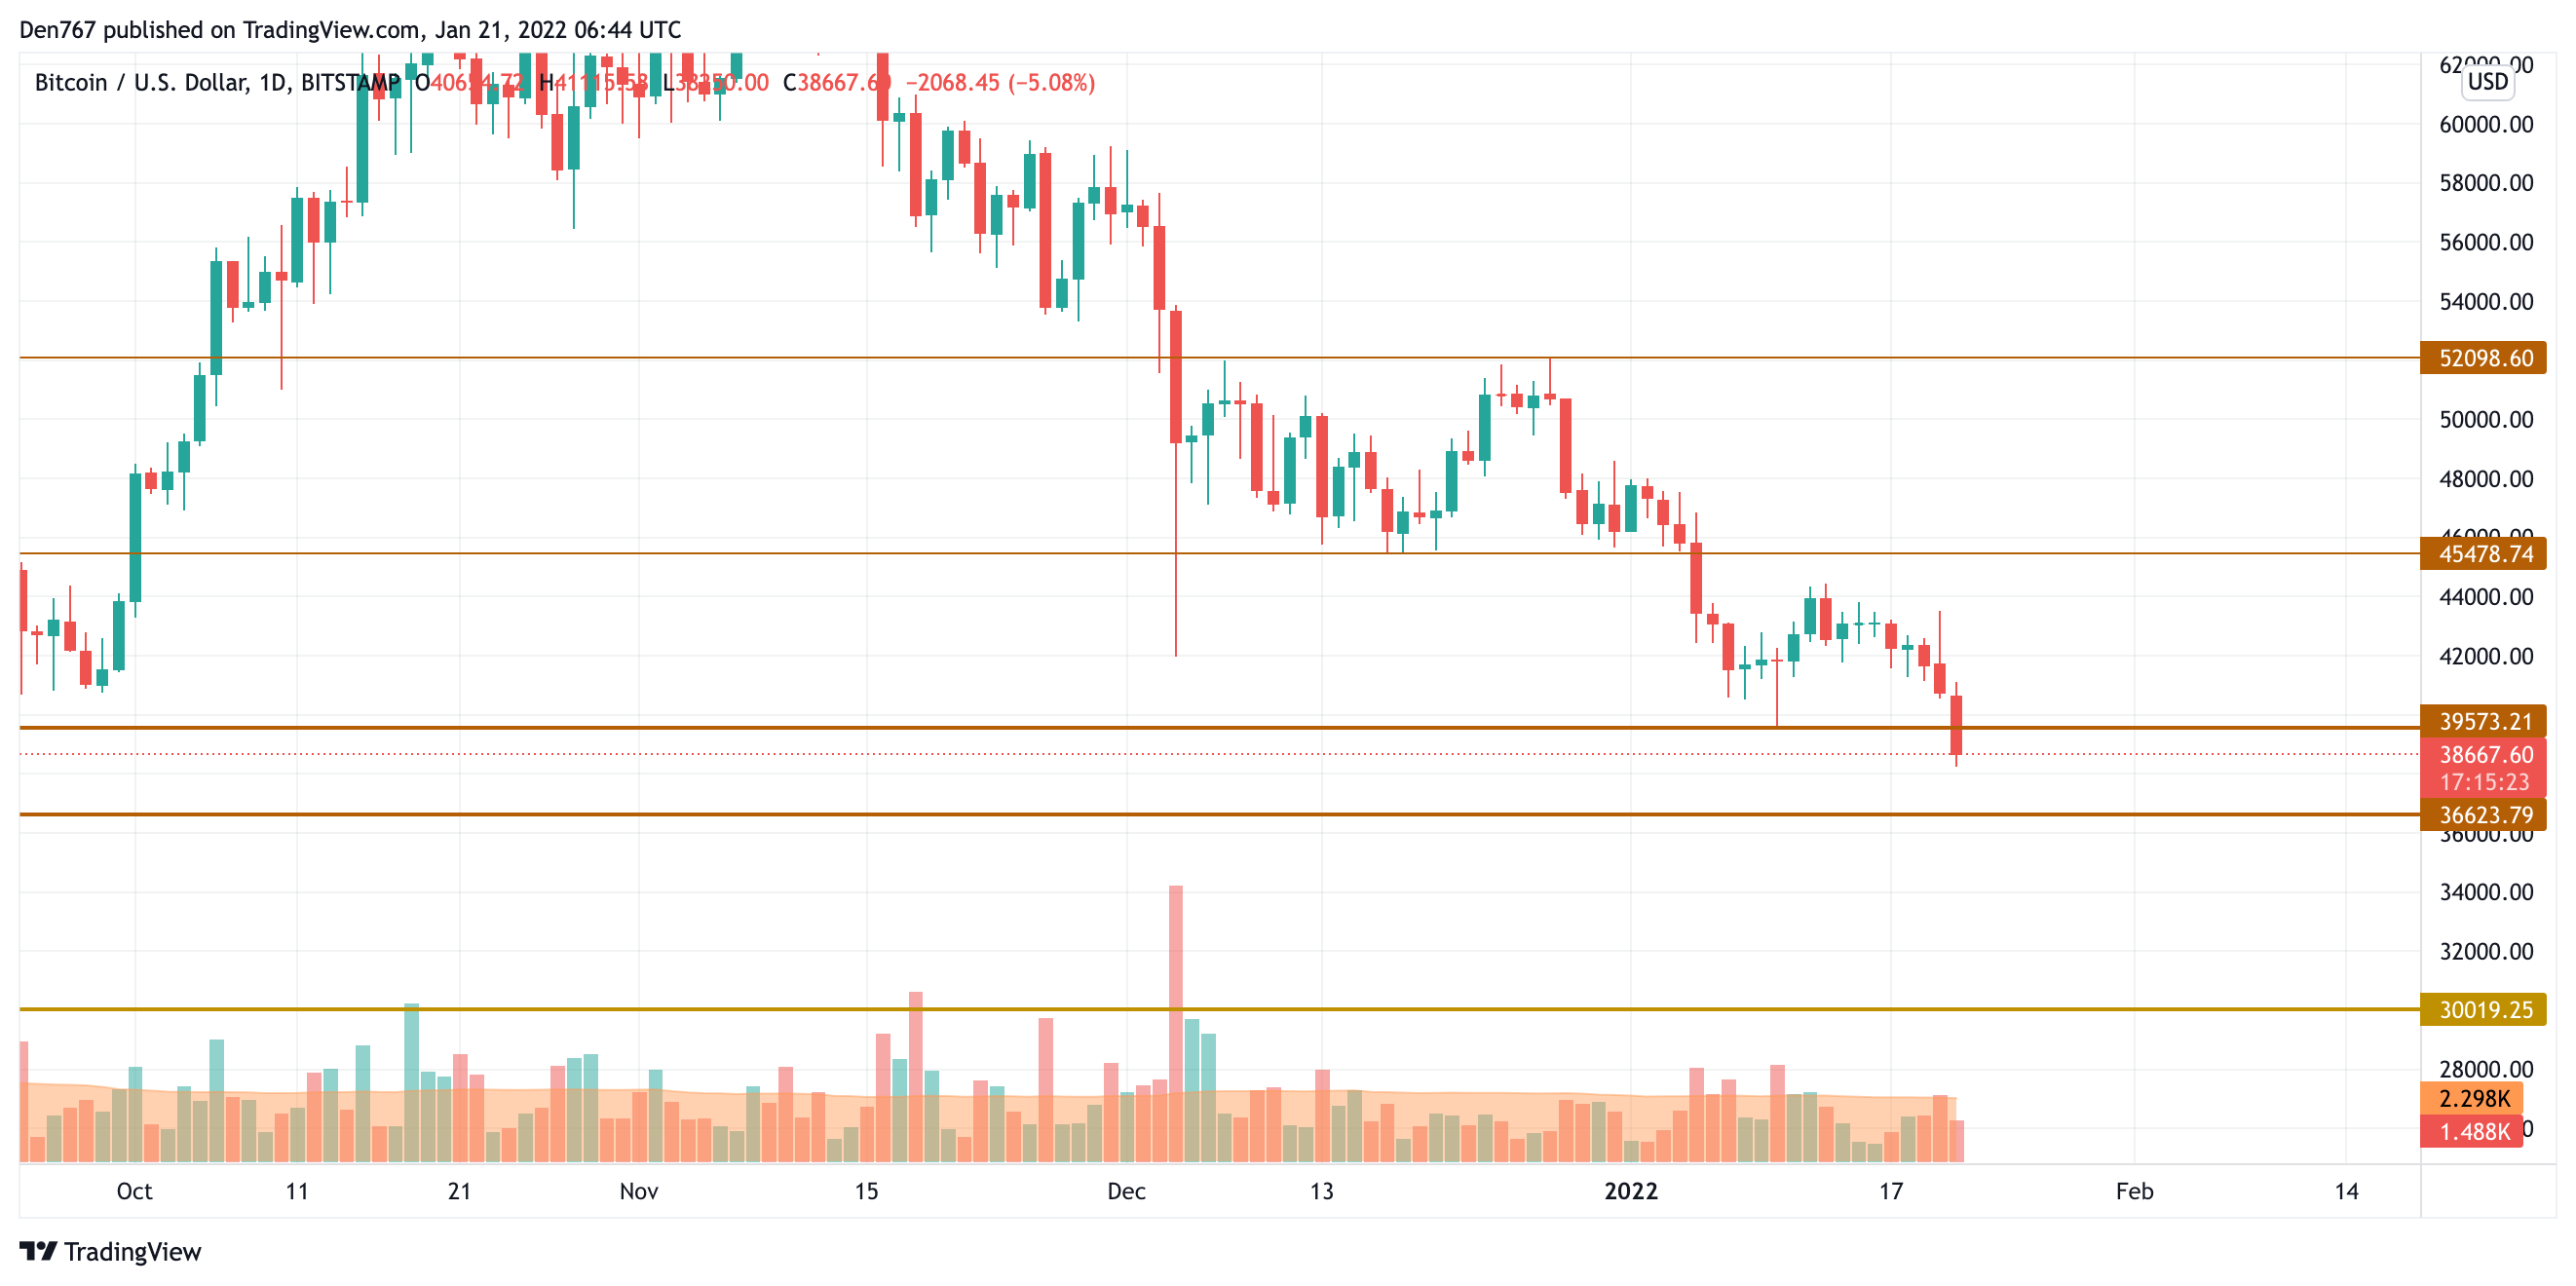
On the daily chart, the price broke the vital support at $39,573, having confirmed the bearish trend. Until the rate is located below this level, bears control the situation on the market.

The next area where a short-term bounceback may happen is the mirror level at $36,623.
Bitcoin is trading at $38,621 at press time.
DOGE/USD
The rate of DOGE has gone much deeper than Bitcoin (BTC), falling by 7.86% since yesterday.
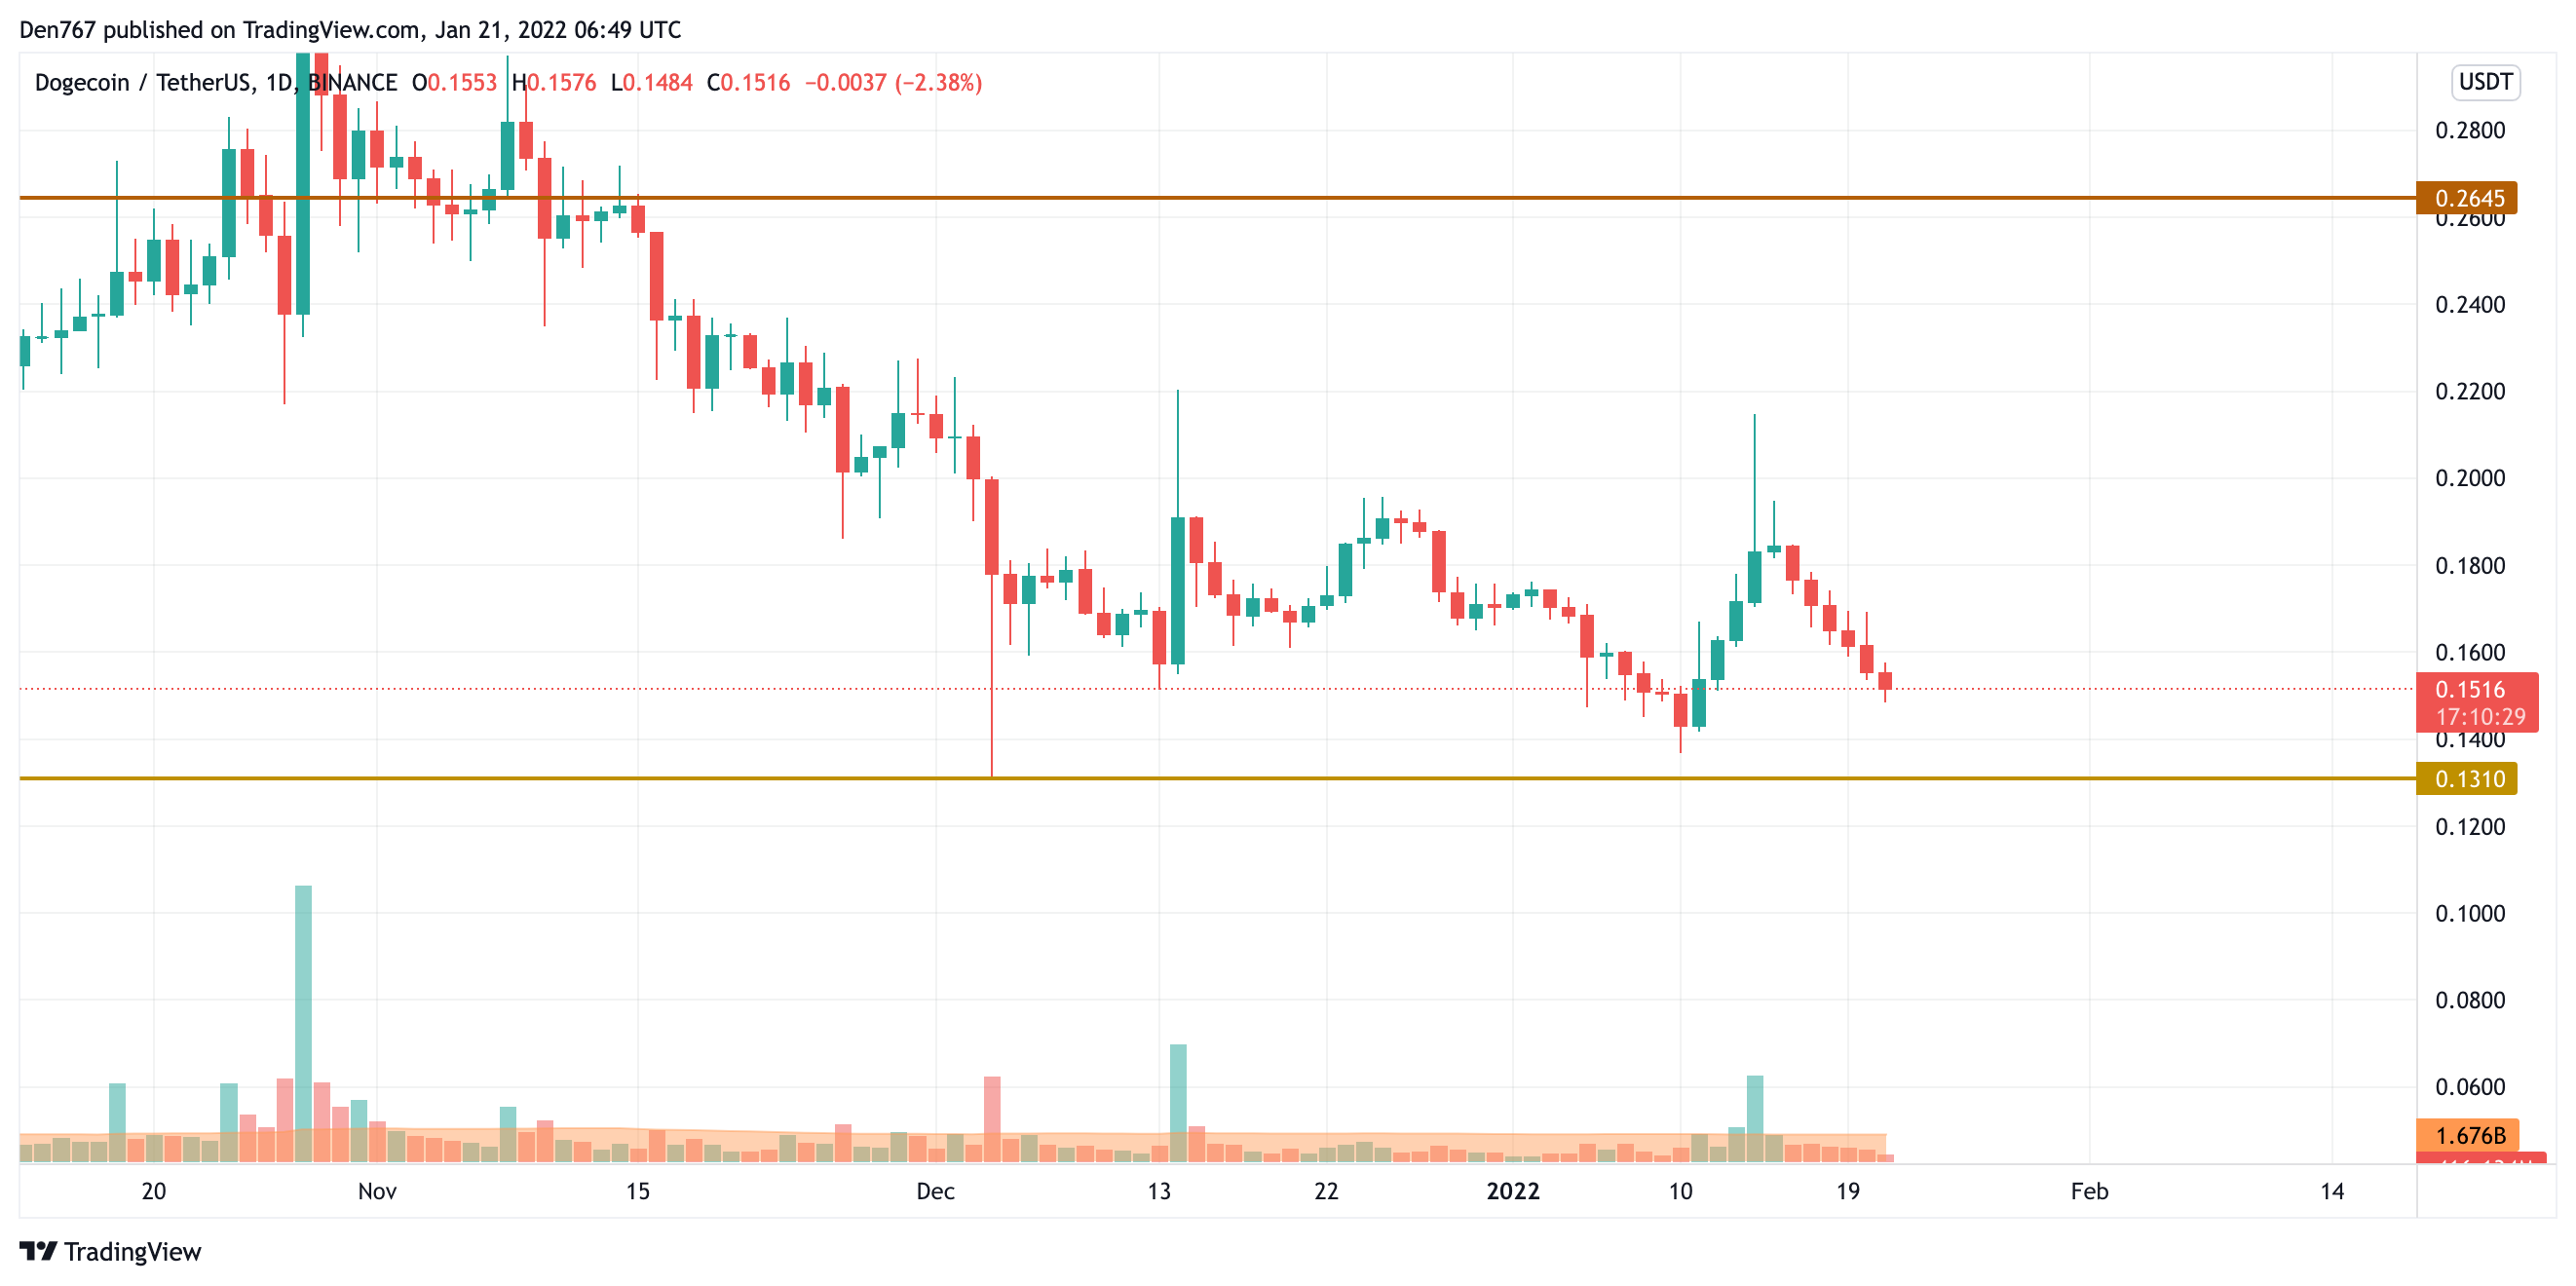
DOGE has been going down for six days in a row with no bounceback signals. At the moment, sideways trading is the more likely scenario until the price is above the support level at $0.1310.

However, if the bears' pressure continues and the daily candle fixes below, one may expect a further drop to $0.10.
DOGE is trading at $0.1516 at press time.
SHIB/USD
The decline of SHIB was the biggest, going down by almost 8%.
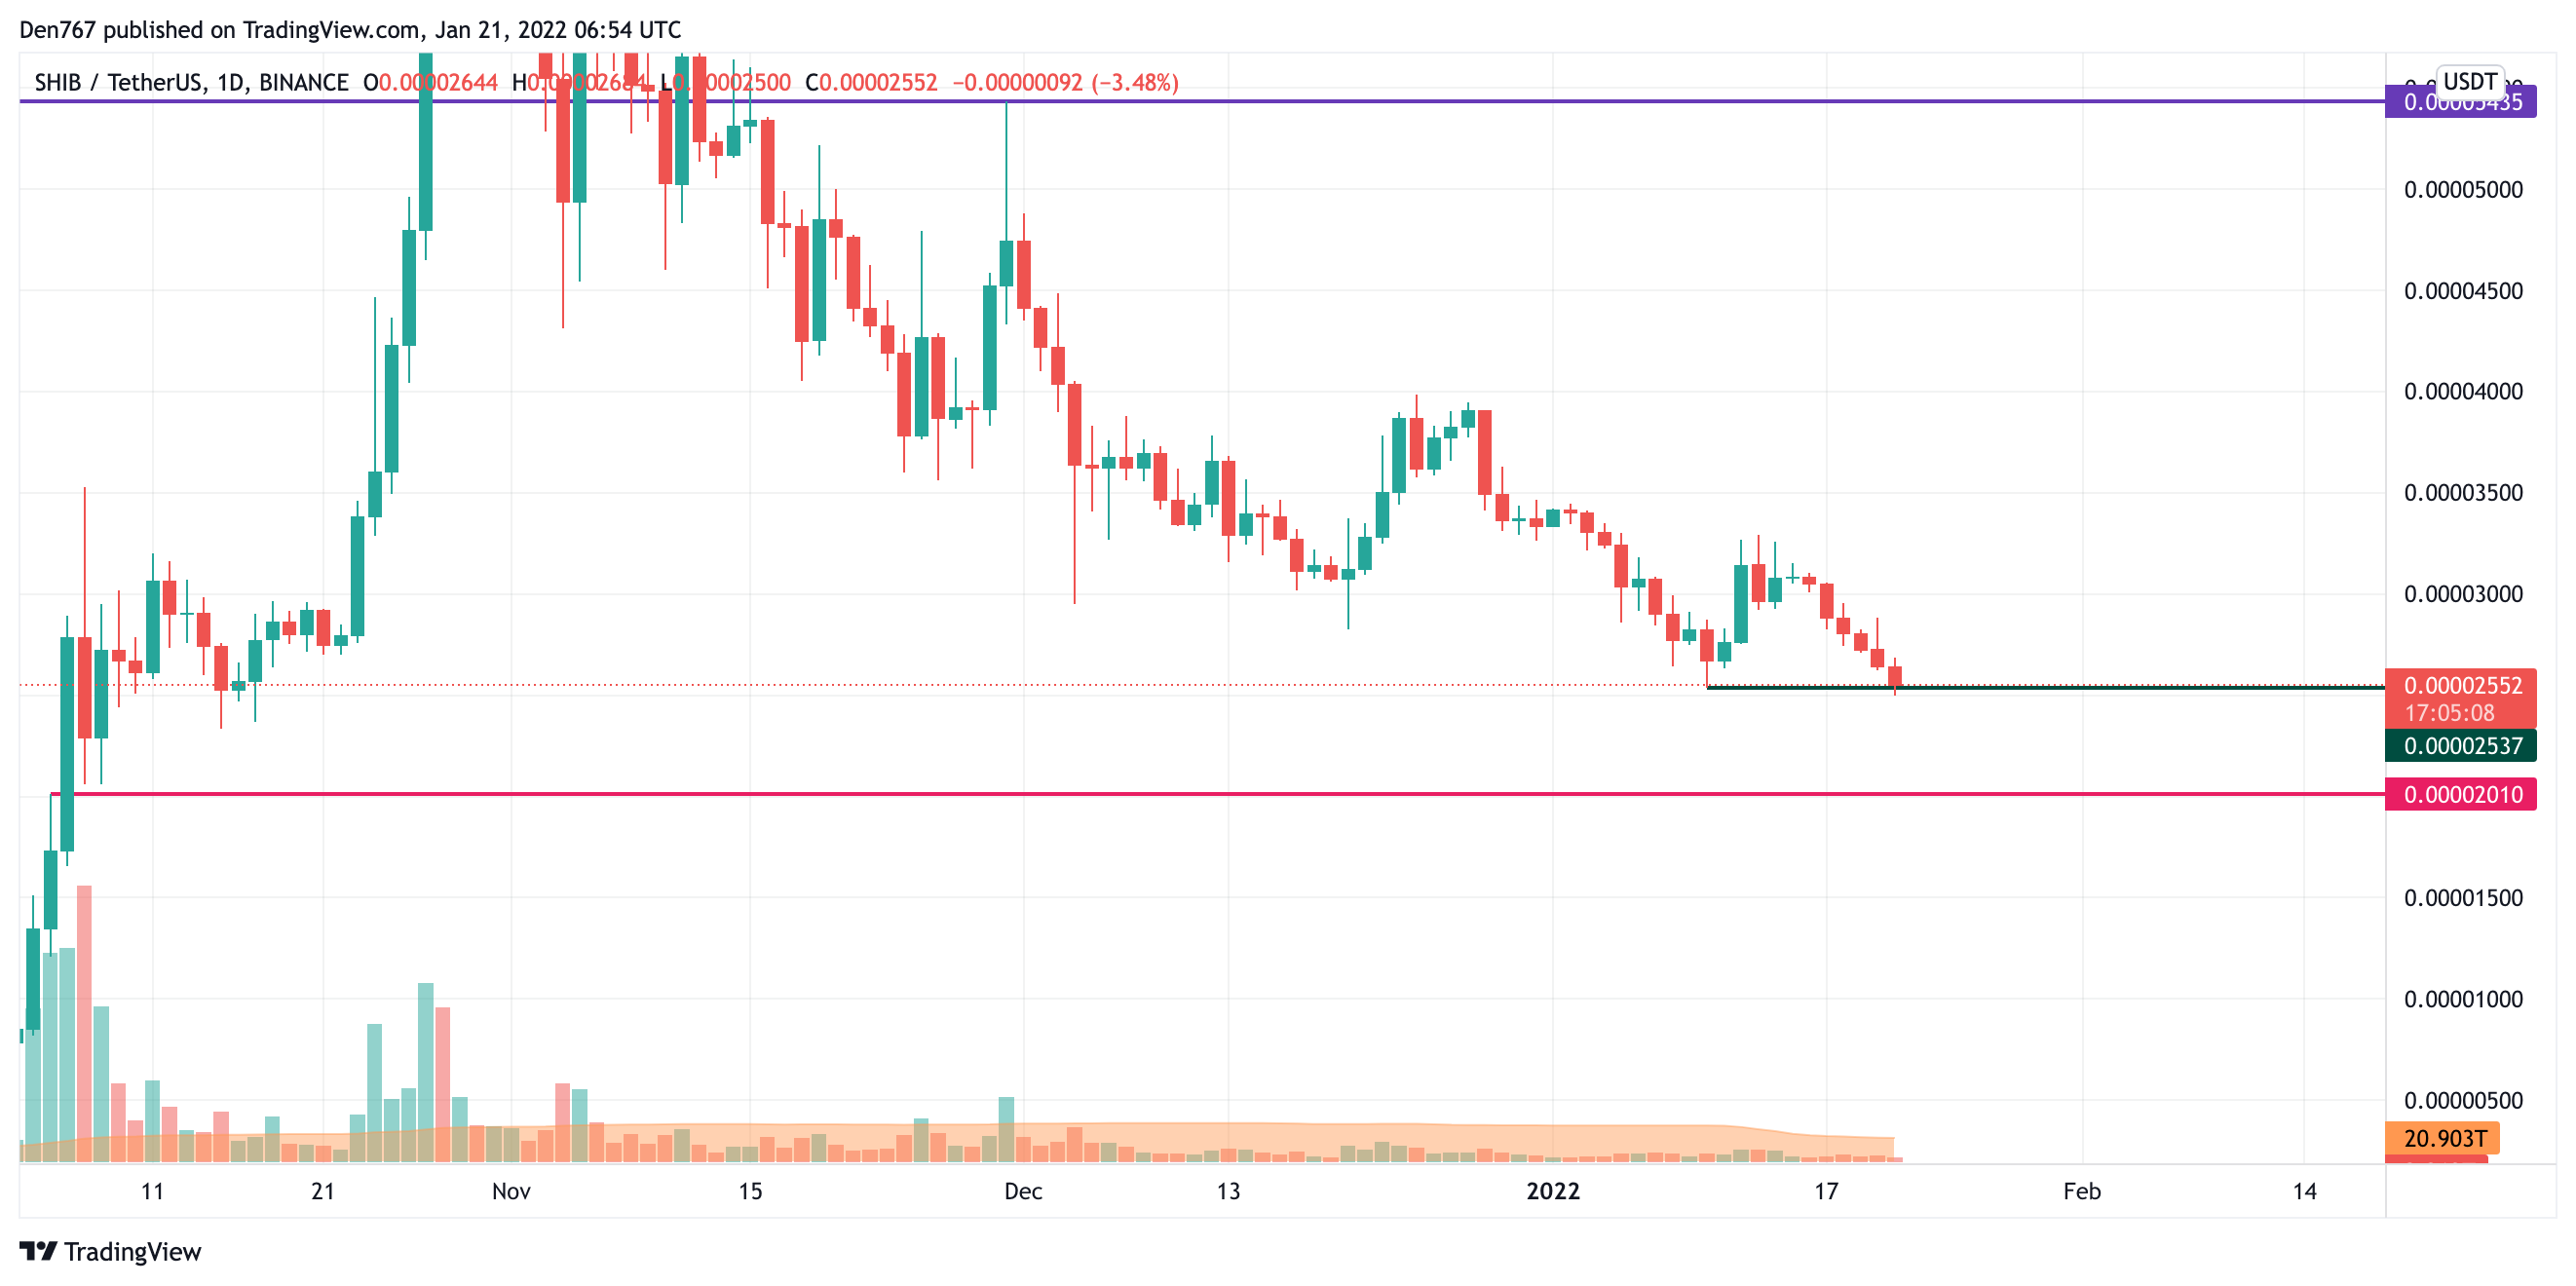
From the technical point of view, one needs to pay close attention to the support level at $0.00002537 as, if the price breaks it, the price drop may get SHIB to the area around $0.00002010 shortly.
SHIB is trading at $0.00002552 at press time.
 Dan Burgin
 U.Today Editorial Team