

Disclaimer: The opinions expressed by our writers are their own and do not represent the views of U.Today. The financial and market information provided on U.Today is intended for informational purposes only. U.Today is not liable for any financial losses incurred while trading cryptocurrencies. Conduct your own research by contacting financial experts before making any investment decisions. We believe that all content is accurate as of the date of publication, but certain offers mentioned may no longer be available.

During the current summer lull, as Bitcoin's endless chop within the $60,000–$66,000 range cuts down sellers and buyers in both directions, increasingly unconventional methods and assessments are being used to analyze the current situation.
One such approach, based on Bollinger Bands on the quarterly chart by TradingView, has revealed that Bitcoin may have already established the macro bottom of the current cycle — and may have done so on the very first day of Q3 2026, at $57,735.
Paradoxically, this hidden pattern has gone unnoticed by most market participants, who remain focused on the exhausting short-term price fluctuations.
Summer low and the September candle trap
The full picture becomes clear when looking at the 3-month timeframe, where Bitcoin precisely tested a key long-term support level.
On July 1, with the very first tick of the quarterly candle, the price immediately fell to a local low before meeting strong buying demand near the middle line of the 3-month Bollinger Bands, which currently stands at $57,431.
By Aug. 11, Bitcoin had returned to $64,174, recording a rebound of nearly 10% and confirming the presence of major capital at these levels.
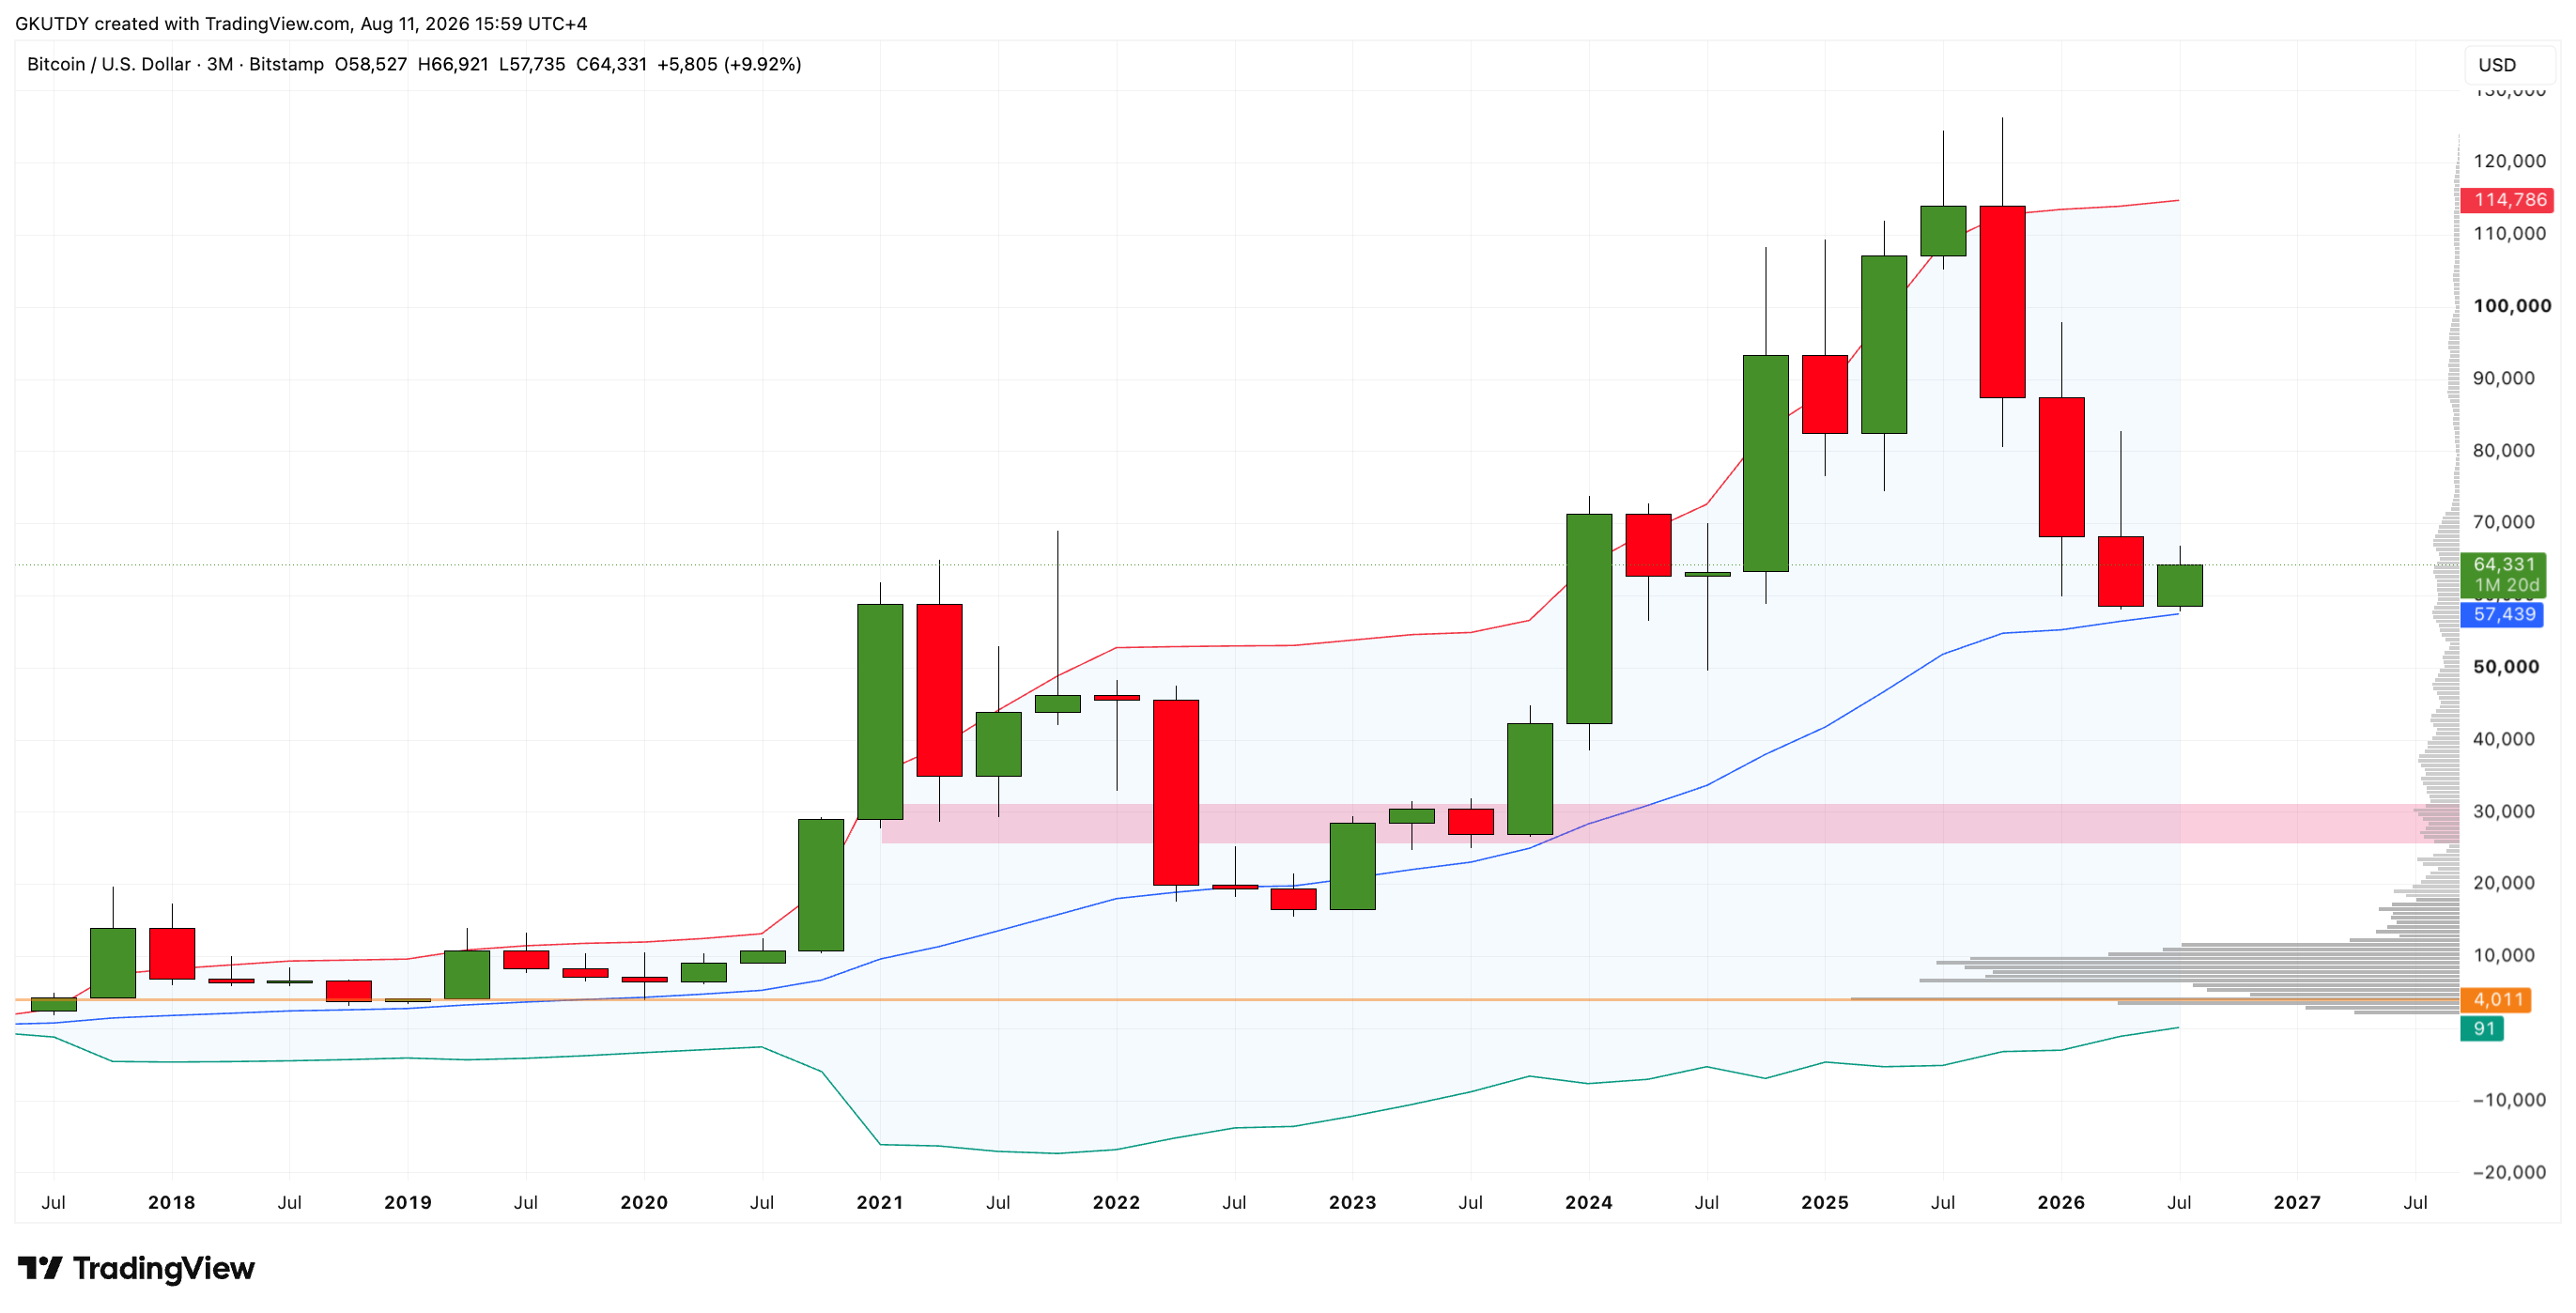
Historical context demonstrates the strength of this zone — similar tests of the quarterly moving average occurred during the final stages of market cleansing in the 2015, 2019 and 2022 cycles.
However, the rebound point recorded on the very first day contains a trap for retail traders because of the mechanics of an open candle. The current 3-month candle will not close until Sept. 30, and until then, it remains dynamic, leaving room for manipulation. Before Q4 begins, Bitcoin still has every chance of moving chaotically up and down, taking passengers on exhausting elevator rides.

Amid reduced seasonal liquidity, major players could push the price lower once again before the end of September, breaking below the July low of $57,735 and collecting the stop orders of panicked traders. For the long-term uptrend, this temporary storm in August does not matter, as the only critically important metric is the quarter's final closing level.
If the candle body closes above $57,431 on Sept. 30, the technical foundation for a powerful autumn growth cycle will be fully in place, confirming that the bottom has indeed already been reached.
 U.Today Editorial Team
 Dan Burgin
