
Buyers have finally made something significant as the whole crypto market rose Saturday. There was a kind of correction phase Sunday, but there are signs of further growth that may happen Monday.
We think that the main reason for such a growth is the fact that Facebook has almost totally changed their minds towards cryptos. We have already mentioned in our previous reviews that Facebook administration is going to accept crypto ads.
Additionally, Facebook is going to acquire Coinbase and issue its own cryptocurrency. This U-turn may be the beginning of huge changes within the community.
As for news, Russia has delayed crypto law adoption putting it off until the end of summer. Russian policymakers asked for more time to make their decisions.
Bitcoin (BTC/USD) Price analysis, July 2
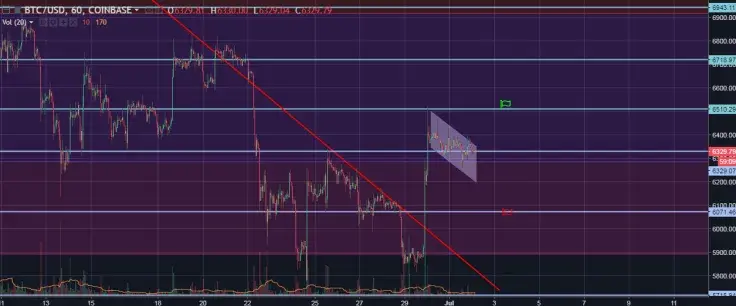
Bitcoin has added less than one percent in the past 24 hours, but the most important events happened on Saturday, when BTC price made a huge upside burst breaking through a couple of resistance areas. BTC/USD seems to finally find its support and thanks to news from Facebook the whole crypto market is positive currently.
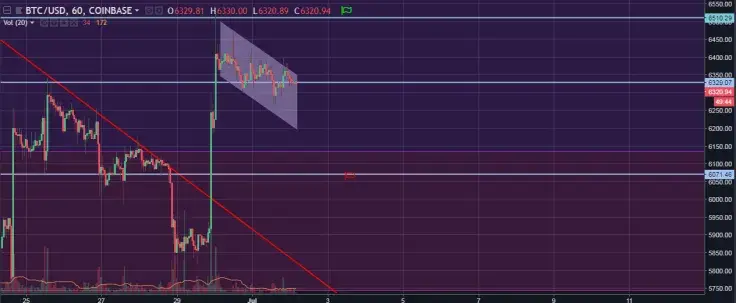 Looking closer at the hourly chart we can see that BTC/USD has jumped over the resistance areas at $6,071 and $6,329. The currency pair stays above $6,329 in the moment of writing, we have a clear flag pattern, which means the probability for Bitcoin to develop its upside tendency.
We think that BTC/USD is going to grow higher targeting the closest resistance area at $6,510, where we have put the green flag. If buyers successful there, they will be able to drive the currency pair even higher targeting the next resistance at $6,943.
The less probable way for BTC/USD is to fall down towards the next support area at $6,071. The flag pattern will be broken in this case.
Ethereum (ETH/USD) Price analysis, July 2
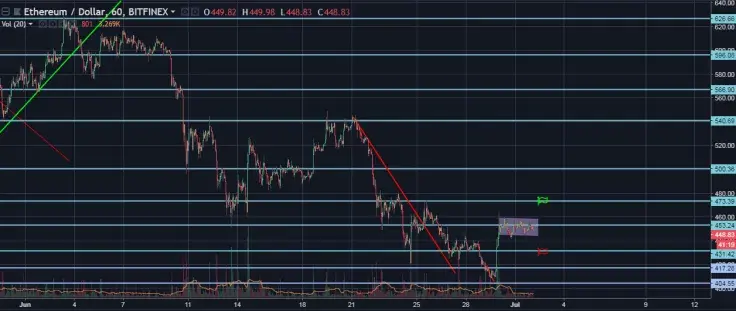
The whole crypto market celebrates Facebook decision as Ethereum has made his way upwards on Saturday following Bitcoin. ETH/USD has almost no changes in the past 24 hours, but the momentum during the weekend was huge. The currency pair seems to change its moods to positive.
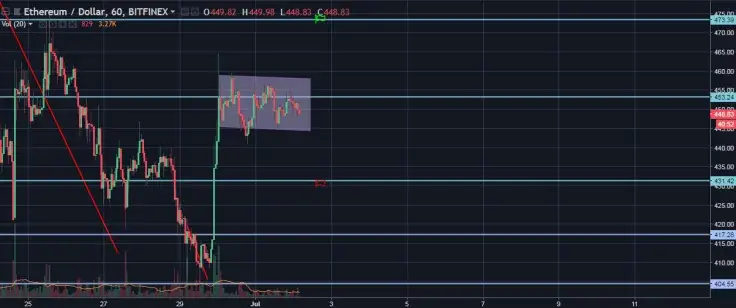
When we look closer at the hourly chart we can see that Ethereum has crossed $417.28, $431.42 resistance areas and is currently testing $453.24 resistance area. We have a flag pattern here as well-meaning bulls have chances to drive the currency pair even higher, targeting the next resistance at $473.29.
If buyers will be able to reach this green flag area, they will test it and once successful, they will be able to drive ETH/USD higher.
However, we advise paying attention to the red flag as well. If the flag pattern fails to develop, ETH price will fall towards the support area at $431.42.
Ripple (XRP/USD) Price analysis, July 2
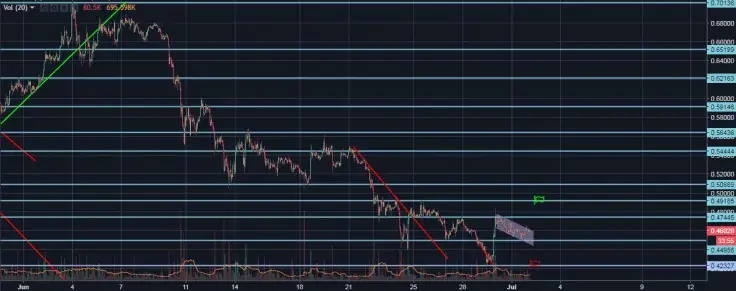
Ripple has added more than one percent in the past 24 hours. The currency pair changed its moods on Saturday following important news from Facebook as famous social media makes a U-turn towards cryptos. Ripple has found support finally. The currency pair looks positive and is able to develop its success.
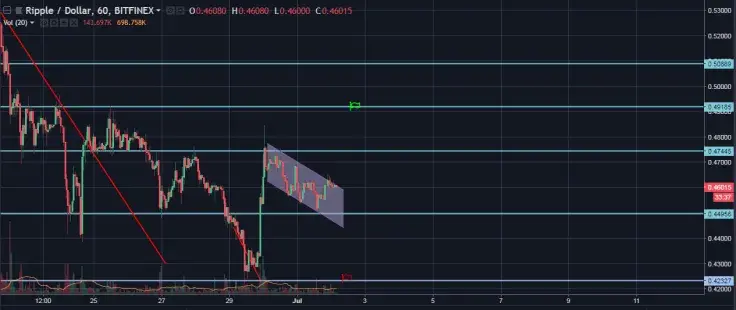
When we look closer at the situation on the hourly chart we can see that Ripple has jumped over the resistance area at $0.4495 and tested the resistance area at $0.4744. The currency pair forms a flag pattern currently meaning there are chances for buyers to develop their progress in the nearest future. We have set the next target for Ripple at the resistance area at $0.4918.
XRP/USD needs to jump over the closest resistance at $0.4744 naturally in order to get our short-term bullish targets. However, if buyers fail, bears will be able to take control and push XRP/USD lower, targeting the next support area at $0.4232.
EOS (EOS/USD) Price analysis, July 2
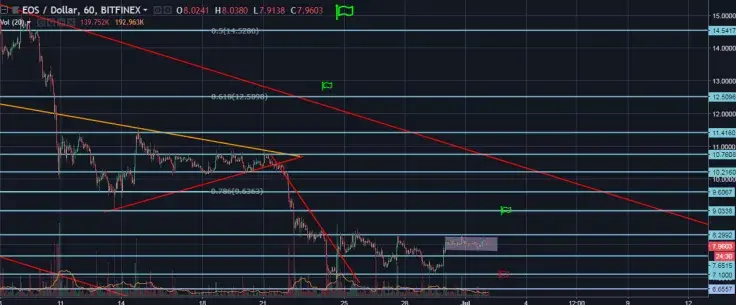
EOS followed its rivals during the weekend showing growth towards the next resistance area. The currency pair seems to change its moods and is able to develop its upside progress in the nearest future. However, in contrast to other allies, EOS seems to stay within the large range.
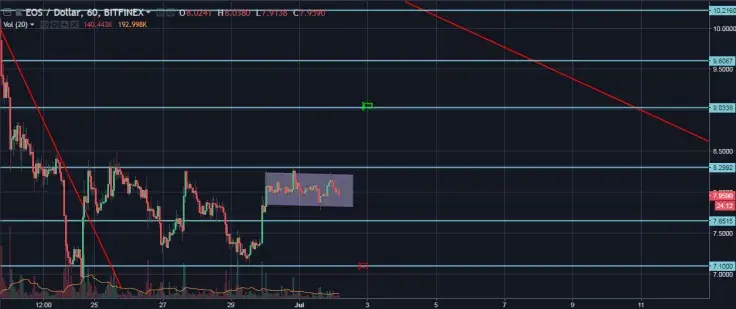
Let’s get down to the current situation on the hourly chart. EOS price forms a flag pattern meaning buyers have chances to develop their upside success. EOS price has jumped over the resistance area at $7.65 on Saturday but was stopped at $8.29 on Sunday.
We have placed our green flag at $9.03 as we think this is the next closest target for EOS/USD in the nearest future if buyers are able to jump over the closest resistance at $8.29. However, if the flag pattern breaks, EOS price is likely to move toward the red flag at $7.10 support area, meaning EOS will return to its local lows.
NEM (XEM/USD) Price analysis, July 2
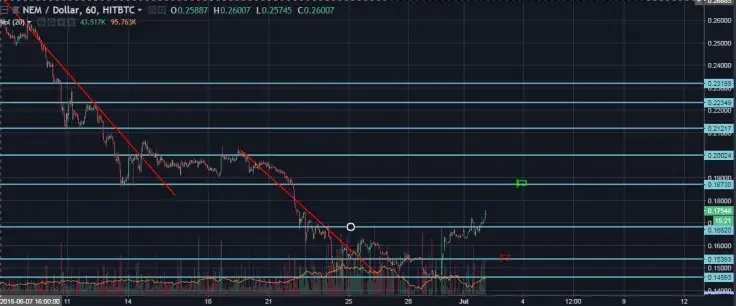
NEM’s buyers celebrate Facebook administration decision as well. XEM price jumped off local lows on Saturday and went upwards. The situation changes to bullish as NEM looks promising.
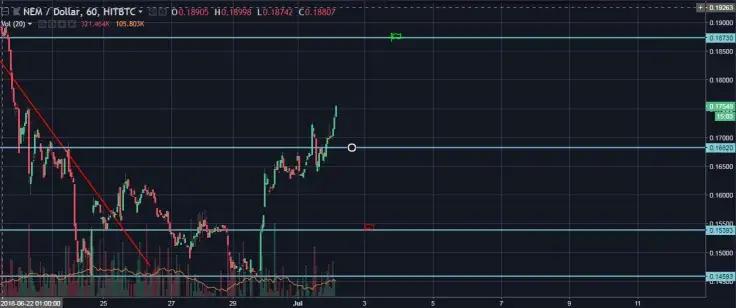
Having a closer look at the hourly chart we can see that the currency pair has crossed the resistance areas at $0.1529 and $0.1682. XEM/USD is likely to move towards the next bullish targets at $0.1873 where we have placed our green flag. This is the main scenario for the nearest future.
However, if XEM/USD falls below the current support area at $0.1682, there will be a probability for NEM to reach the local lows at $0.1459 again (the sellers need to jump over the closest support at $0.1529 in this case).
 Gamza Khanzadaev
 Arman Shirinyan
 Dan Burgin
 Alex Dovbnya