Disclaimer: The opinions expressed by our writers are their own and do not represent the views of U.Today. The financial and market information provided on U.Today is intended for informational purposes only. U.Today is not liable for any financial losses incurred while trading cryptocurrencies. Conduct your own research by contacting financial experts before making any investment decisions. We believe that all content is accurate as of the date of publication, but certain offers mentioned may no longer be available.
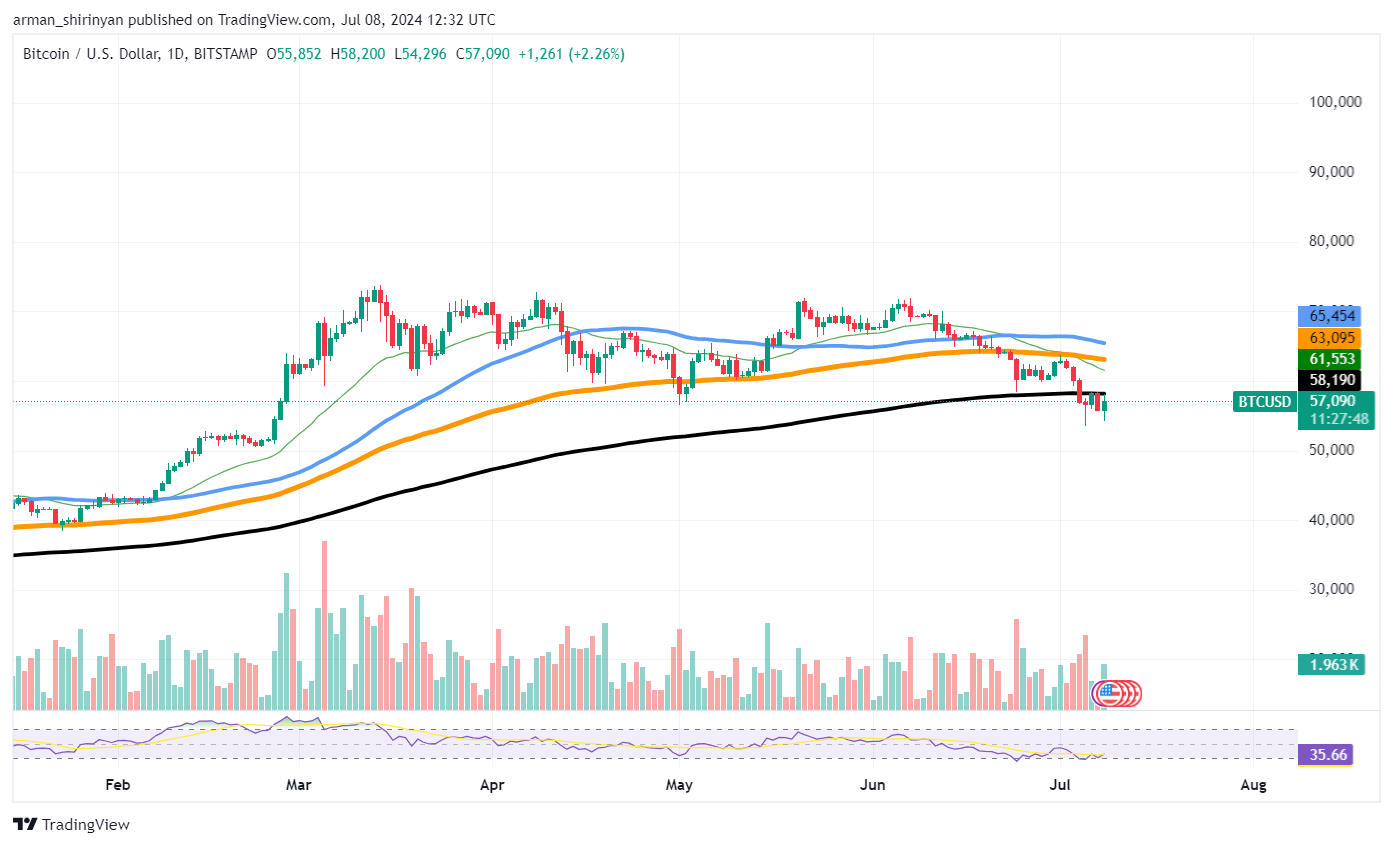
Bitcoin is slowly but surely standing up on its feet, with the price somewhat gaining stability at around the $56,000 price level. Unfortunately, the buying power is not there, and the market clearly needs another boost. The so-called "bullish megaphone" pattern might be the answer.
An indication of potential for a significant surge in technical analysis is often shown by the bullish megaphone pattern. Known by another name, this pattern consists of two diverging trend lines, one sloping downhill and the other upward, giving the chart the appearance of a megaphone.

Price movements are expanding between the two trend lines exhibiting an increasing degree of volatility characteristic of this pattern. It usually develops following a phase of sideways or consolidation trading, indicating that the asset is preparing for a breakout. This is how it functions:
Formation: As prices fluctuate between higher highs and lower lows, the pattern begins to take shape. The shape of a megaphone is produced by price swings that get bigger than the one before.
Volatility increase: The volatility rises as the pattern develops. As price movements increase in magnitude, the market frequently becomes confused and uncertain. One important aspect of the bullish megaphone pattern is its increased volatility.
Breakout: This pattern's ultimate breakout is its defining characteristic. This breakout normally occurs through the upper trend line for a bullish megaphone. The breakout, which is supported by higher buying interest and trading volume, denotes robust upward momentum.
Target price: Following the breakout, the target price is typically determined by measuring the pattern's height at its widest point. The possible upside is then calculated by adding this measurement to the breakout point.

 Arman Shirinyan
 Alex Dovbnya
 Dan Burgin
 Gamza Khanzadaev