Disclaimer: The opinions expressed by our writers are their own and do not represent the views of U.Today. The financial and market information provided on U.Today is intended for informational purposes only. U.Today is not liable for any financial losses incurred while trading cryptocurrencies. Conduct your own research by contacting financial experts before making any investment decisions. We believe that all content is accurate as of the date of publication, but certain offers mentioned may no longer be available.
Binance Coin (BNB) looks ready to leave a prolonged downtrend based on signals from the popular charting indicator, the Bollinger Bands. Some analysts and even enthusiasts think BNB could rally back to the $1,000 milestone soon.
Bollinger Bands signal potential Binance Coin price rebound
BNB entered a short-term bear phase in early November, dropping approximately 22% from its October all-time high of $1,370.55.
As of press time, the BNB price hovered around $914. This marks a test of psychological support near $900-$920, amid broader crypto market weakness.
However, the Binance Coin price could rebound soon based on the Bollinger Bands'signal. As seen on a TradingView chart, the BNB price has dipped below the lower Bollinger Band, with the middle band acting as a rebound target.
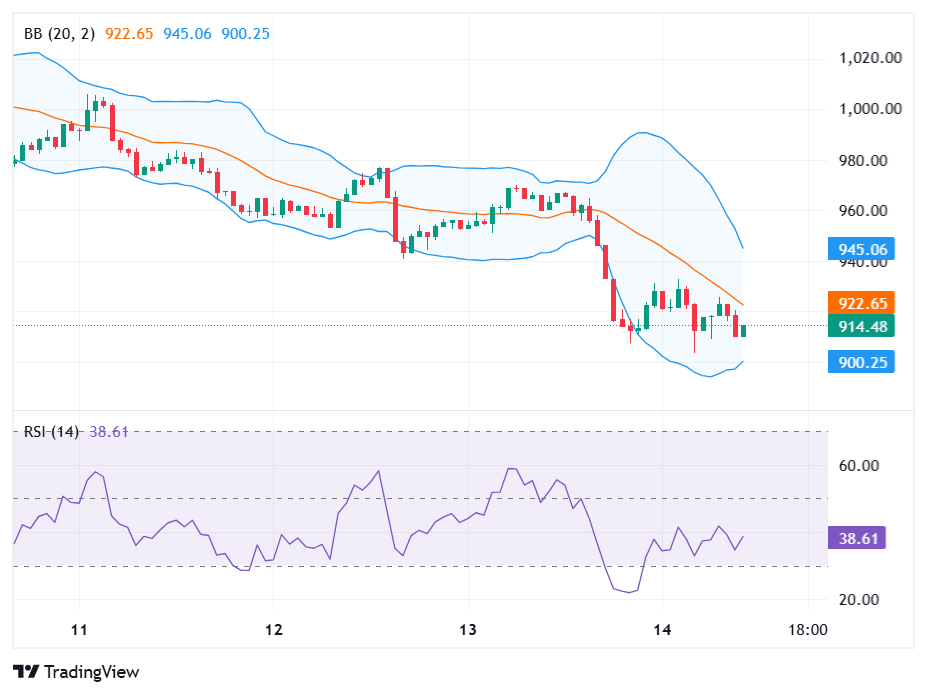
The chart shows a clear downtrend from $1,020 to a low of around $914.48, with a series of red candles dominating. However, the last few candles are smaller with lower wicks, suggesting sellers are exhausting near the lows. Still, buyers are not stepping in aggressively yet.
As seen on the chart, the BNB price is very close to the lower Bollinger Band. Also, the bands are moderately expanded, indicating elevated volatility from the 5.6% drop in the past 24 hours.
Can BNB reclaim $1,000?
The BNB price could rebound between $1,050-$1,100 if the lower band touch stretches to a positive daily close. Such a move could potentially mark the end of the bear market, especially if strong buying pressure continues.
Bands are expanding from earlier squeezes, often preceding reversals. Historical BNB data showed that lower Bollinger Band touches led to rallies in previous cycles.
Meanwhile, the Relative Strength Index (RSI) is currently at 38.61, down from earlier higher levels. While the index is approaching oversold territory, it remains neutral, with the line still showing a downward slope.
No divergence is visible as momentum is bearish but not extreme. Notably, RSI at 38.61 is low enough to deter further selling.
Additionally, Binance ecosystem growth and stabilization of the Bitcoin (BTC) price could amplify the upside potential for BNB.
One of the latest ecosystem developments is the introduction of the Fermi hard fork on the BNB chain. The Fermi hard fork would drop the block interval by 40% from 750ms to 450ms. This move is expected to boost transaction efficiency, throughput and the network's overall performance.
 Dan Burgin
 U.Today Editorial Team