
Disclaimer: The opinions expressed by our writers are their own and do not represent the views of U.Today. The financial and market information provided on U.Today is intended for informational purposes only. U.Today is not liable for any financial losses incurred while trading cryptocurrencies. Conduct your own research by contacting financial experts before making any investment decisions. We believe that all content is accurate as of the date of publication, but certain offers mentioned may no longer be available.

Cardano (ADA) rarely ranks among the leading assets on exchange liquidation charts, usually giving way to BTC or ETH. However, the situation changed in early August as margin traders became overly confident that the token would fall toward $0.15 and opened one-sided bets on further downside.
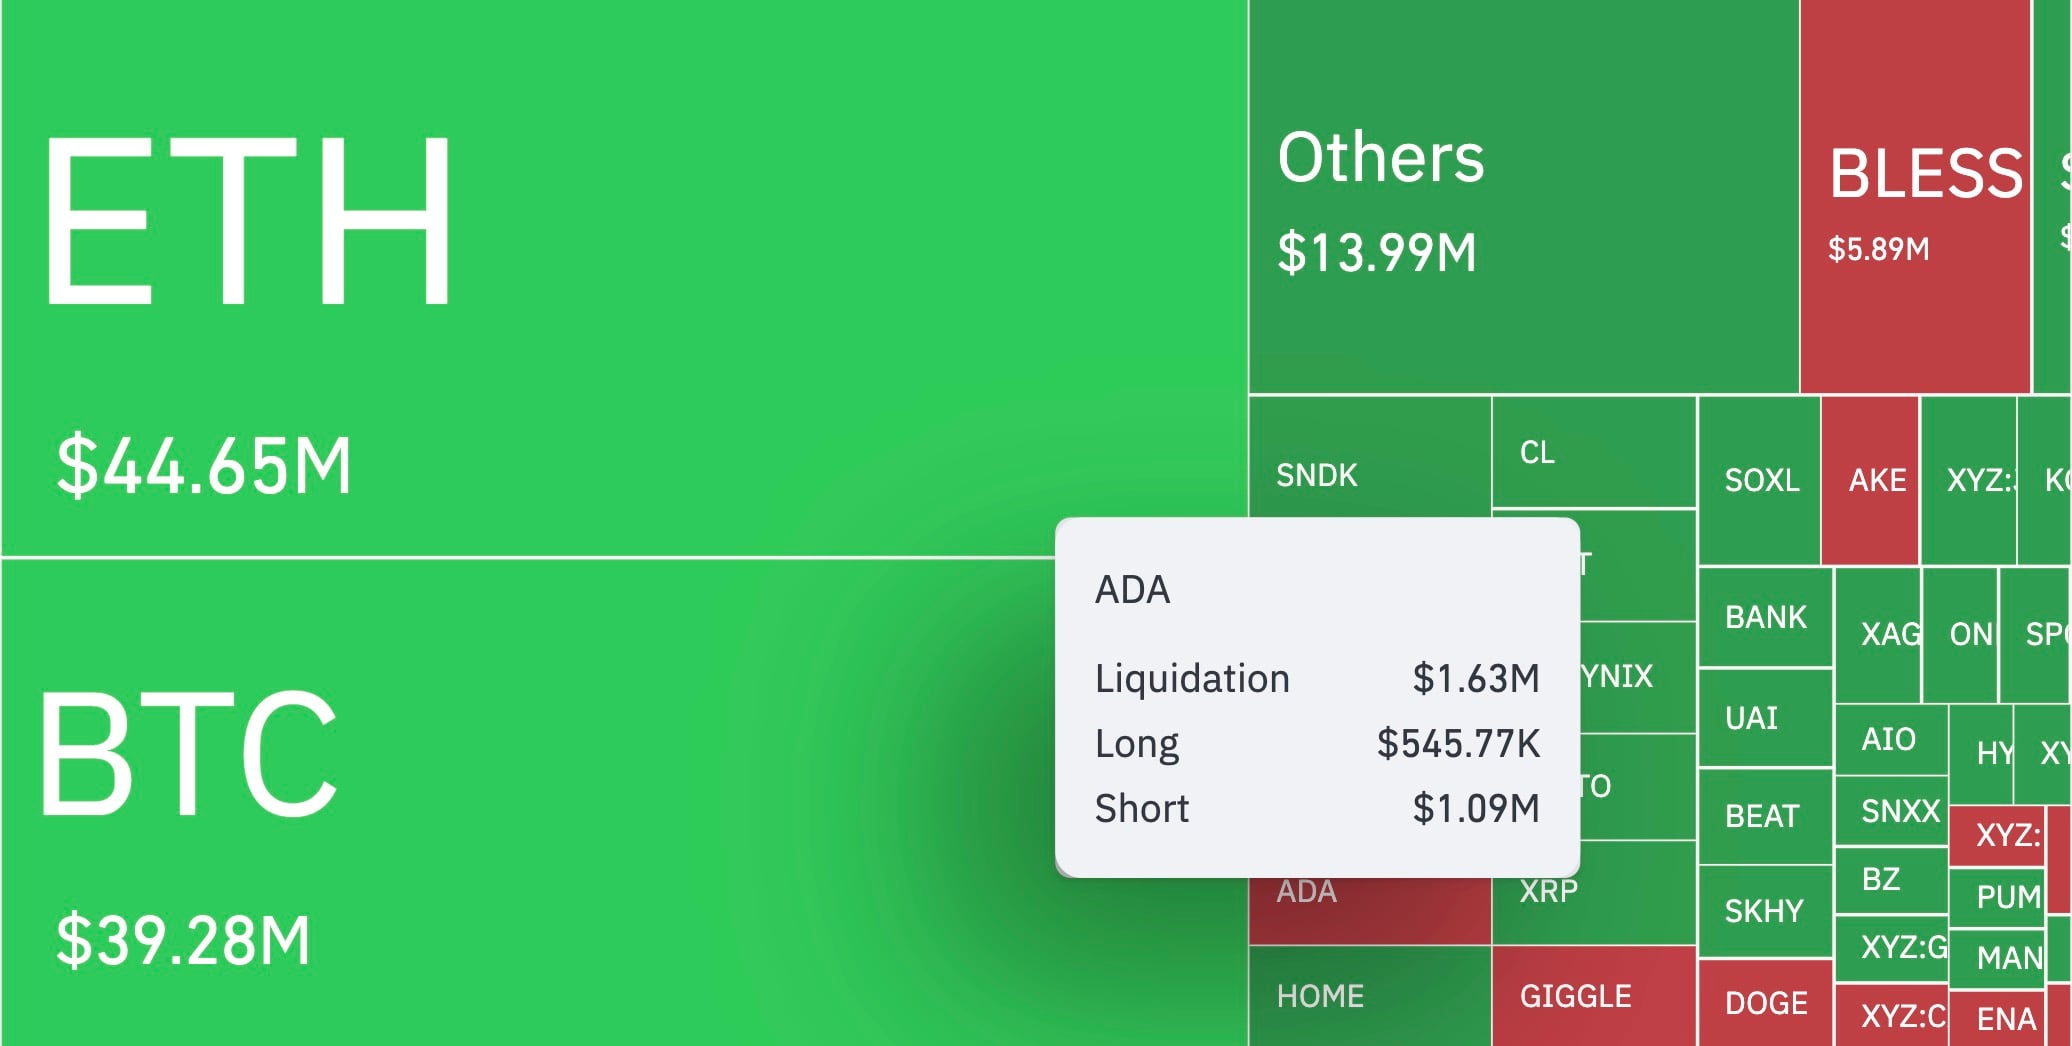
As a result, a local price reversal triggered more than $1 million in short liquidations as per CoinGlass.
The hourly chart shows exactly how this trap closed. In late July, the token found a local bottom at $0.150. Bears assumed that the support level was about to break and began selling aggressively, but instead of moving lower, the price reversed and started climbing.
The main action began during the attack on the $0.185 level. An impulsive breakout above this mark to a peak of $0.193 caused margin calls to begin triggering across sellers' positions.
The forced buying of ADA to cover short sellers' losses accelerated the rally and pushed the token into the top liquidation rankings.
Why ADA's path of least resistance leads upward
CoinGlass's liquidation heat map clearly shows the scale of the damage suffered by bears. A total of $1.63 million worth of ADA positions was liquidated, with $1.09 million, or more than 66%, lost by short sellers.
A major imbalance emerged on the futures market, as longs suffered almost no damage while short sellers were systematically forced out one after another. Following this move, the price cooled slightly to $0.1857, turning the former heavy resistance barrier into a new support line for buyers.
Although the first wave of the squeeze has subsided and the RSI indicator has fallen to 54.22, the game is not over for sellers. The "Max Pain" map shows that the market's main liquidity magnet is located directly above the current price.
The next major pool of short liquidations, worth $1.12 million, sits at $0.19396.

To trigger a second wave of forced short closures, ADA needs to rise by only 4.45%, or approximately $0.008. At the same time, buyers have a much larger safety margin below: the price would need to fall by more than 7% to reach their risk zone at $0.17102.
The current balance of forces shows that the liquidity pools above the price are twice as close as the support zones below. Therefore, bulls need only one brief push toward $0.194 to force sellers out again.
 U.Today Editorial Team
 Dan Burgin
