
Disclaimer: The opinions expressed by our writers are their own and do not represent the views of U.Today. The financial and market information provided on U.Today is intended for informational purposes only. U.Today is not liable for any financial losses incurred while trading cryptocurrencies. Conduct your own research by contacting financial experts before making any investment decisions. We believe that all content is accurate as of the date of publication, but certain offers mentioned may no longer be available.
XRP has experienced notable volatility in the recent past, with its price dynamics closely monitored by the crypto community. Over the past few weeks, this cryptocurrency has managed to break through significant resistance levels, hinting at potentially more significant price movements on the horizon.
A notable observation is XRP's movement past both the 200-day and 50-day Exponential Moving Averages (EMAs). EMAs are crucial technical indicators that traders and analysts use to determine the general trend of an asset over a given period. For XRP, surpassing these critical EMAs signifies a potentially bullish trend, especially when considering this movement in the context of broader crypto market sentiment.
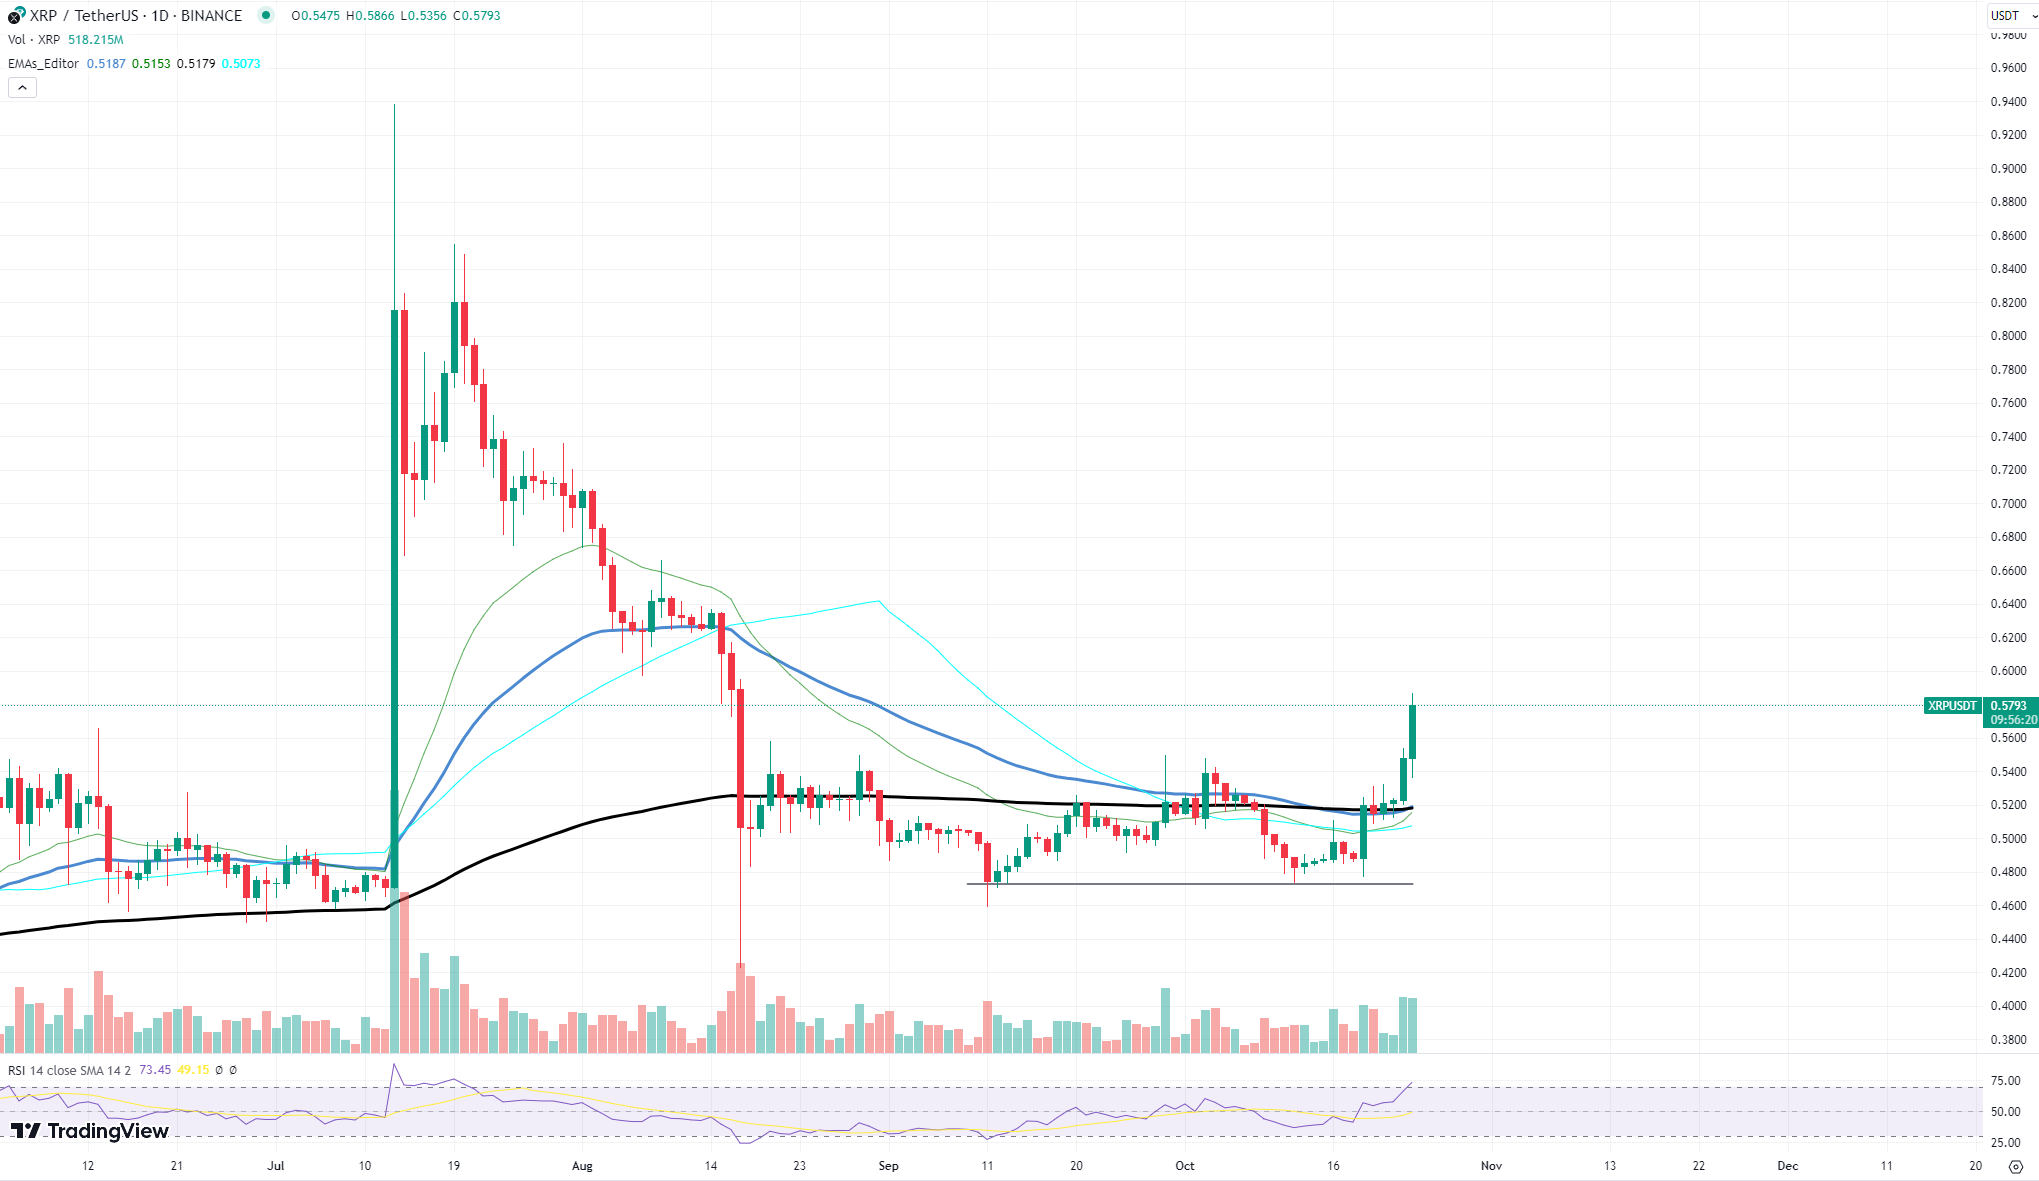
Adding to the bullish narrative is the formation of a golden cross on the XRP chart, signaling the potential for a significant price rally. Historically, golden crosses have been precursors to robust bullish movements, though they may sometimes deliver false signals.
The current momentum can be partly attributed to the positive sentiment surrounding Bitcoin's surge to $35,000, which often acts as a benchmark for the rest of the crypto market. However, specific headlines related to XRP have likely played an even more significant role.
Recently, XRP registered its most substantial single-day gain in three months. This leap followed the U.S. Securities and Exchange Commission's (SEC) decision to drop the charges against Ripple's leaders. This news has considerably buoyed the confidence of XRP holders and potential investors, leading to a surge in buying activity.
Bitcoin takes spotlight
In the last 24 hours, Bitcoin has finally confirmed one widely shared thesis: a crypto bull market is just around the corner. Having observed its chart, it is evident that there is significant growth, but the question on everyone's lips is, what's the next target?
Diving deep into the chart, the cryptocurrency has successfully carved out a base, oscillating above crucial support levels. The recent parabolic run has been supported by substantial volume, a clear indication of robust interest from the investing community.
As traditional fiat currencies continue to suffer from inflationary pressures, Bitcoin's deflationary nature makes it an attractive hedge. Many see Bitcoin as the "digital gold," a store of value in uncertain economic times. The current inflationary environment is making a compelling case for digital assets, with Bitcoin leading the charge.
Recent headlines have alluded to the nearing approval of a Bitcoin ETF. Drawing parallels to the first gold ETF, the Bitcoin community is abuzz with excitement. As history suggests, the launch of the gold ETF provided a significant boost to gold prices.
The technical indicators are clear; Bitcoin is entering a new bull market phase. The RSI is well within bullish territory, and the MACD has been persistently signaling buying momentum.
The chart showcases Bitcoin breaking past significant resistance levels, especially the notable $35,000 mark, which was corroborated by a surge in trading volume. What is more interesting is the momentum it has gathered after crossing the 50-day and 200-day exponential moving averages. These crossovers, typically seen as strong bullish indicators, have in the past paved the way for sustained bull runs.
SHIB needs more momentum
With attention-grabbing headlines surrounding the meme coin, analysts and investors alike are trying to discern the potential trajectory of this digital asset.
Taking a closer look at the SHIB chart, the token has recently showcased a notable bullish trend. The momentum is further confirmed by a steady increase in volume. Additionally, the price recently surged above its downtrend line, which acted as a resistance for the past couple of months. The Relative Strength Index (RSI) is hovering around the 60 mark, suggesting that there is still room for upward movement before it enters the overbought territory.
A key driving force behind SHIB's recent rally is its soaring burn rate, which has jumped an astounding 567%. As tokens get burned or removed from circulation, the existing supply becomes scarcer, potentially driving up demand and price. This dramatic burn rate can be a double-edged sword: while it suggests a strong community-driven effort to bolster the coin's value, it can also imply an artificial push that may not be sustainable in the long run.
 Dan Burgin
 U.Today Editorial Team